In this blog post, I will explain how I have set up GDB on my host machine for debugging an application on STM32MP157D-DK1:

Table of Contents
- Development Workstation Setup
- GDB setup for embedded systems
- Automating repetitive tasks
- Useful resources
Development workstation setup
I have set up an NFS server on my development machine as well as configured U-Boot on STM32MP157-DK1 so that any built binaries of interest on the host are easily accessible on the target machine. Also, I have set up SSH to establish a connection with the target board. For more details, check out the first two chapters of this document from Bootlin.
GDB setup for embedded systems
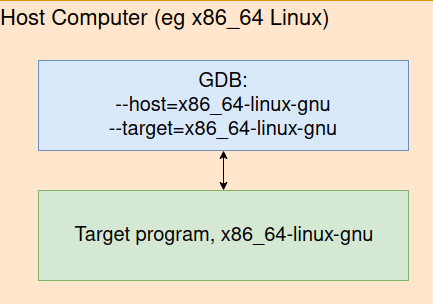
By its default configuration, GDB targets binaries that are being run on the same architecture as the host system GDB is running on:

Screenshot captured from Memfault’s Interrupt page describing tools they use
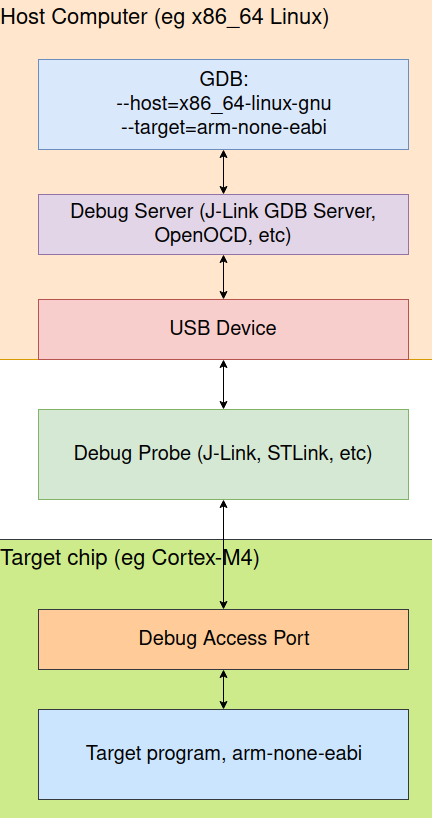
When targeting an embedded device, GDB has to be configured in a way that it supports the target architecture of the program being debugged:

Screenshot captured from Memfault’s Interrupt page describing tools they use
Binaries generated for embedded devices are often stripped of debug information to save storage space. This is also why native GDB should not be installed on an embedded target (around 2.5 MB on x86).
For that reason, remote debugging is preferred. ARCH-linux-gdb is used on the development host instead of the native GDB allowing the developer to use all features that native GDB provides. On the target side, gdbserver is used (around 400 KB on arm). It allows connecting to a fully featured remote GDB. This server handles requests from the GDB client, such as setting breakpoints, reading memory or stepping through code.
Before we start debugging, keep in mind that there are several lightweight graphical interfaces that make debugging easier. One is the default TUI that comes built-in with GDB that you enter by typing lay next when in GDB and the other is gdb-dashboard that I have just discovered recently and which I am quite fond of. It creates a .gdbinit file and populates it with sensible configuration for debugging. It enables you to use well-known shortcuts within GDB like ctrl + r for reverse searching of GDB commands you typed previously which the out-of-the-box installation of GDB does not provide. It also appends additional debug information and coloring to your console that I find quite useful.
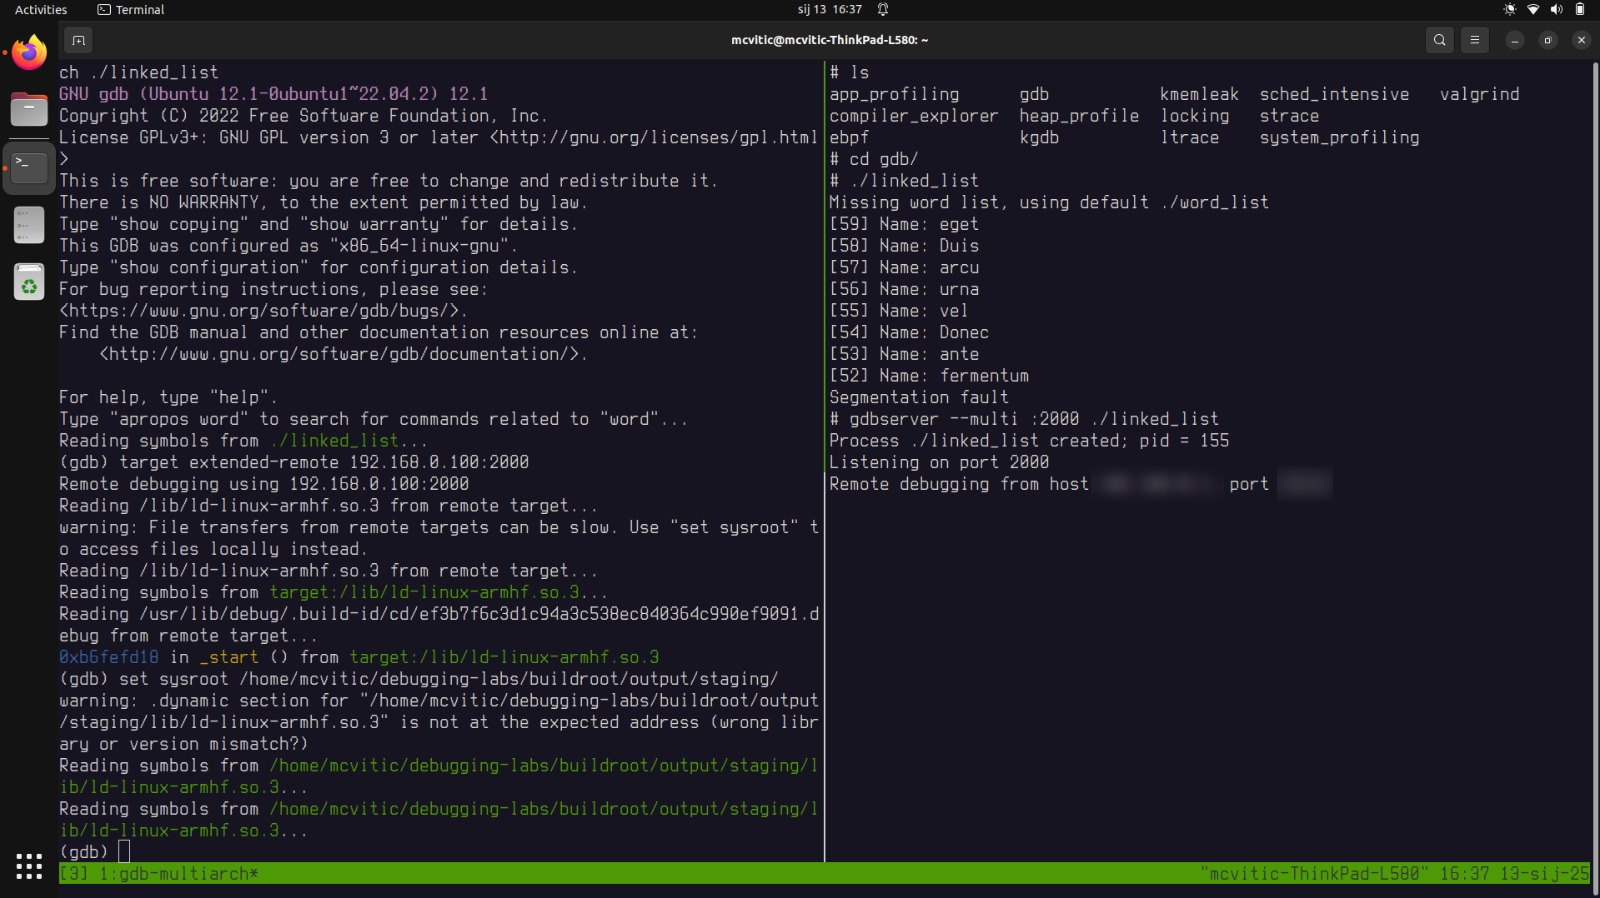
Running ./linked_list on the target will cause a segfault. Now, let’s start the program on the target using gdbserver in multi-mode and break down what each of the commands mean:
# gdbserver --multi :2000 ./linked_list
gdbserverstarts the GDB server which acts as an intermediary between./linked_listand a GDB client on the host machine--multiflag allows multi-process debugging and launching sessions dynamically- instead of automatically attaching to
./linked_listat startup, this option sets up the GDB server to accept multiple debugging sessions and wait for a remote GDB client to specify which executable to debug
- instead of automatically attaching to
:2000specifies the port that the GDB server will listen on for incoming GDB client connections -./linked_listnormally specifies the program that GDB server will debug, but this argument is ignored because of the--multioption and the target program is not launched until the remote GDB client specifies it
In a separate terminal on your host machine, run export CROSS_COMPILE=/home/$USER/debugging-labs/buildroot/output/host/arm-linux-
- this export needs to be done in each shell in which
CROSS_COMPILEis going to be used or added to the shell configuration file (I am using bash, so.bashrc) exportcommand sets theCROSS_COMPILEenvironment variable and makes it available to all child processes indicating to the build system that the binary being built is meant to be run on a different architecture than the one you are working on/home/$USER/debugging-labs/buildroot/output/host/is the directory where Buildroot has placed the cross-compilation tools.
Next, install gdb-multiarch and run gdb-multiarch ./linked_list. You have now entered GDB and inside it, run the following:
(gdb) target extended-remote 192.168.0.100:2000
- this allows connecting to a remote target GDB server and also reconnecting after the server restarts
targetsets the target system GDB will controlextended-remoteallows multi-process debugging where GDB starts new programs on the target or attaches to running processes
- this command is commonly used with
gdbserverstarted in--multimode
NOTE: this applies if the connection with the board was established via SSH. If it was established over a serial connection, run target remote /dev/ttyUSB0, or which device it was mapped on when the board was connected to the host machine.
Finally, run:
(gdb) set sysroot /home/<user>/debugging-labs/buildroot/output/staging/
- this tells GDB where to find the root filesystem of the remote target on the local, host machine where files for debugging are located
- when debugging remote programs, GDB might need access to shared libraries, binaries and other files from the target’s root file system which are not available on the local host machine’s filesystem
- by using this setting, GDB now points to a mirror of the target’s filesystem from where it can load the correct library versions, display complete stack traces and resolve symbols for debugging
Automating repetitive tasks
Instead of retyping exact and specific commands every time you establish a connection with a target you device, you can edit your .gdbinit file which does it for you. Also, GDB has powerful Python support that it can be used to automate application debugging more efficiently by utilizing GDB’s Python API
Useful resources
A couple of useful sites I have found regarding using GDB is Jacob Sorber’s Debugging C Programs playlist, Memfault’s Interrupt GDB blogs and of course Bootlin’s Linux debugging, profiling and tracing and performance analysis training. I highly recommend you check out other topics of theirs if you are interested in embedded software development. Special thanks to Bootlin for providing the source code.
If you would like to support the work I do, consider donating here.