I configured the Linux kernel core to dump a core file that I analyzed in order to find the root cause of a segmentation fault:

In this blog post, I will set up the working environment exactly the same as I described in previous post. A coredump is a file that that holds the recorded state of the program’s memory at moment of crash. This kind of static analysis is useful when code crashes occur in end-of-line testing, or worse yet, out in the field when it has been shipped to the customer. Wherever they occur, coredump files are sent to developers for a debugging session.
Table of Contents
Introduction
One thing that has to be taken into account in software development is the difference between debug build and release build binaries. Debug builds have a larger memory footprint due to additional debug symbols that compiler uses for debugging purposes, whereas build binaries are often stripped off of this additional information. As suggested by Jacob Sorber in his Can I Debug Release Code? video, the best of both worlds approach would be to compile your release binaries with debug symbols, but then strip them afterward before shipping them to the customer which will decrease binary size but still leave you with an option to debug a program using a coredump. I highly recommend you check out this video if you I piqued your interest on this topic. As always, special thanks to Bootlin for providing the source code.
Running coredump through GDB
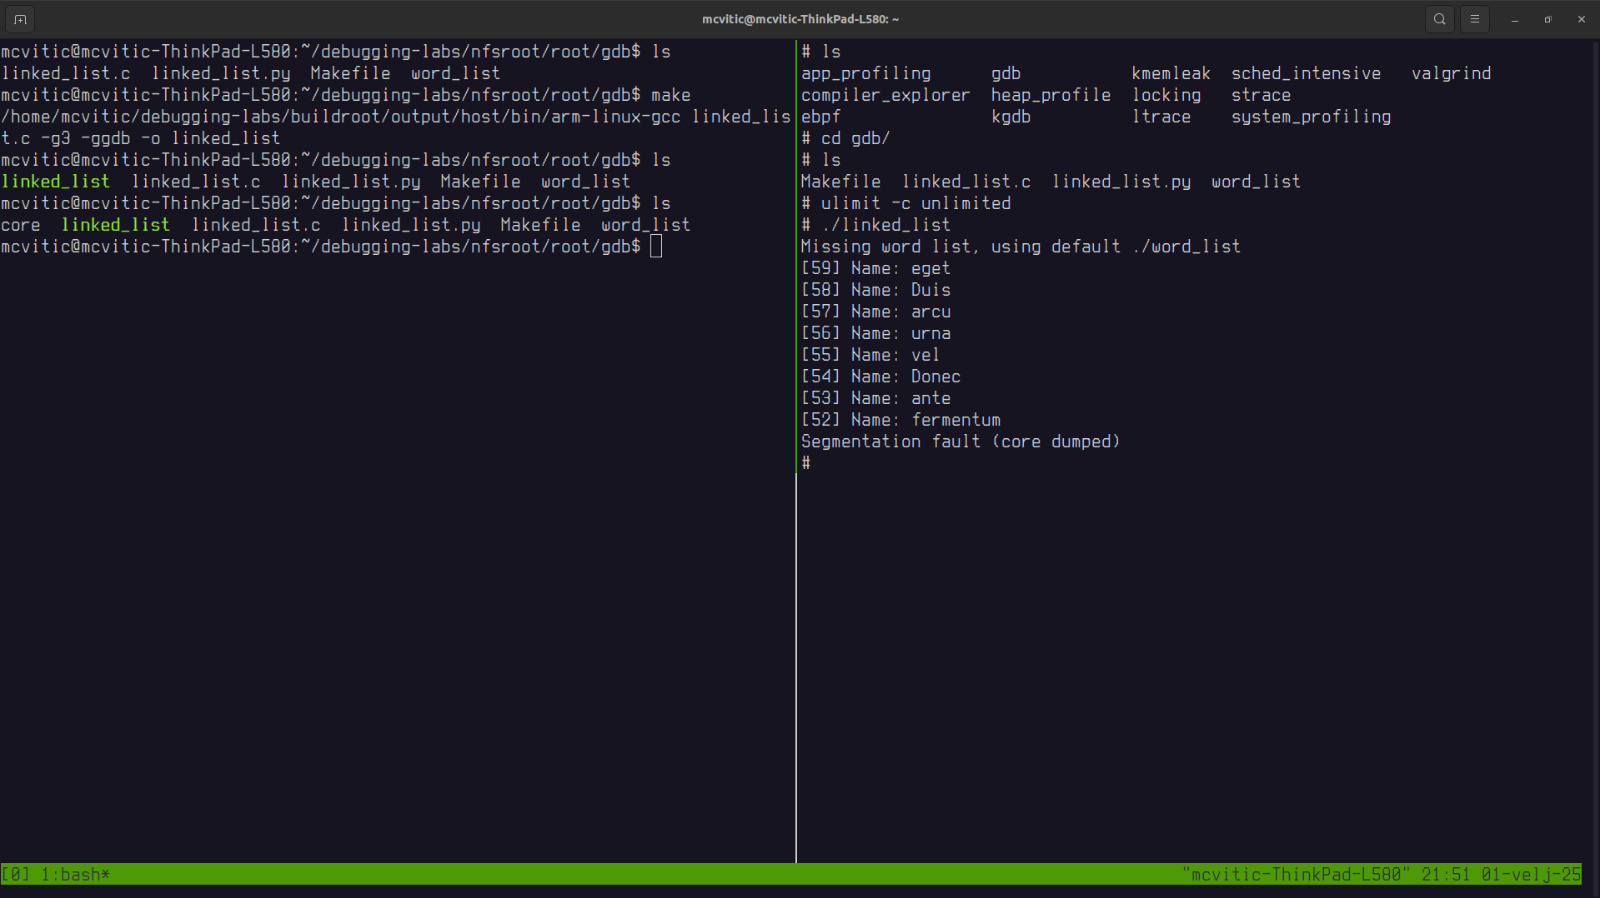
In order to configure the Linux kernel to generate such a file, run the following on the target machine:
# ulimit -c unlimited
which removes the size limit of coredumps that are going to be saved. By default, they are set to zero on most machines (i.e. they don’t get generated).
Them, run ./linked_list again and observe that a core file has been generated:

On your host machine, change the permissions by running:
$ sudo chown $USER:$USER core
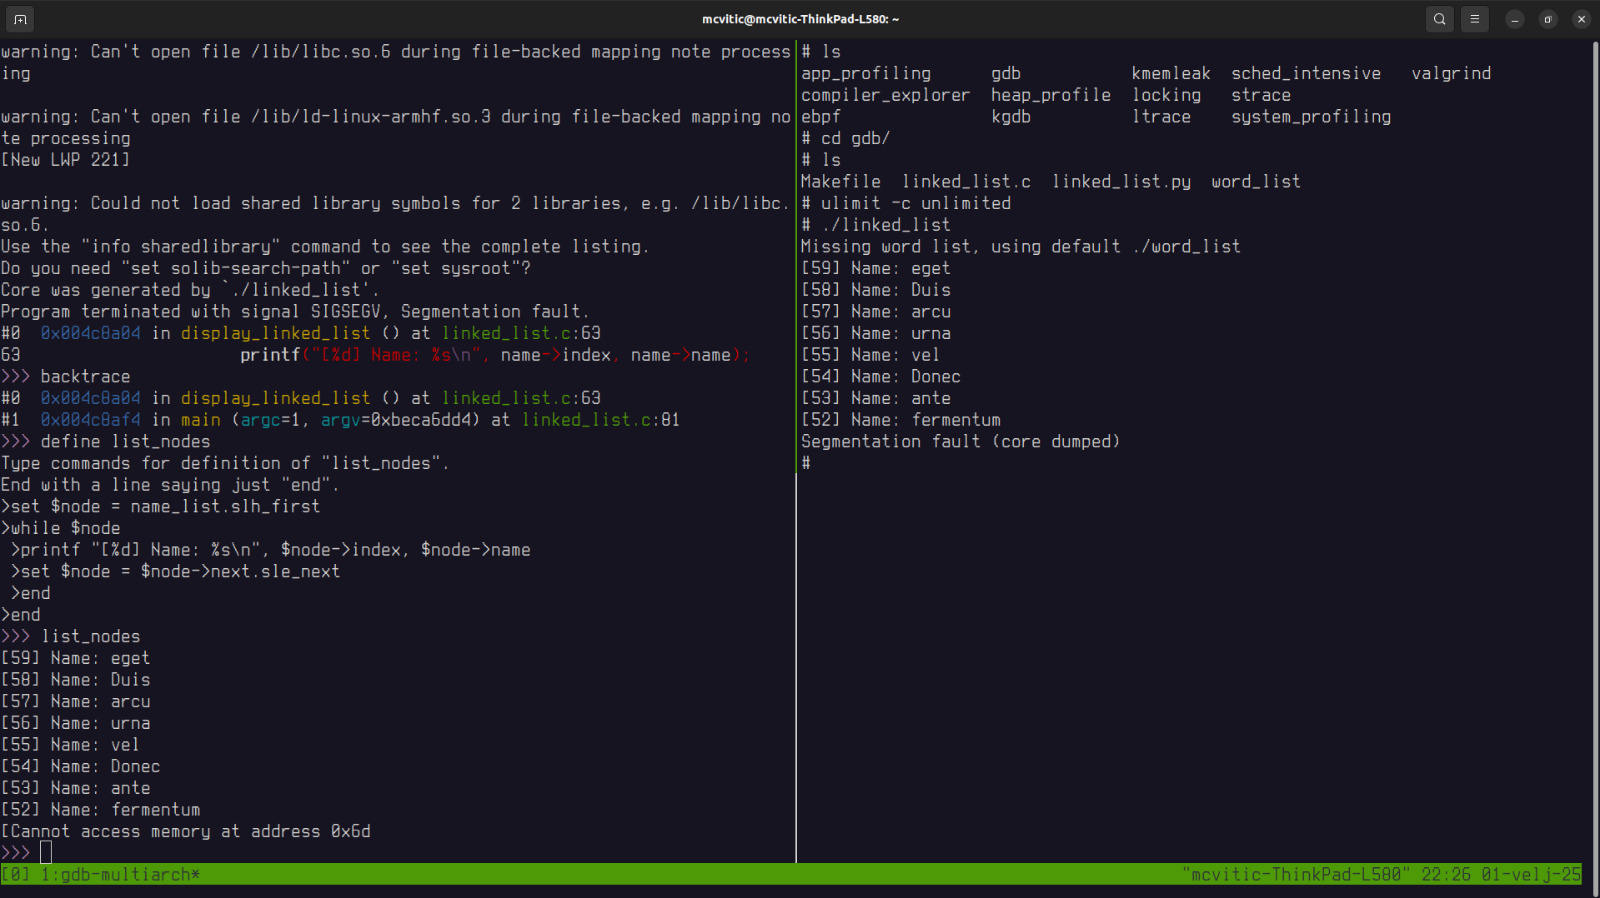
and run the failed program with the coredump in GDB which will point you to the exact moment your program crashed:
$gdb-multiarch ./linked_list ./core

Coredump analysis is less dynamic than the usual way of debugging binaries we execute live on GDB. It nevertheless still allows you to pinpoint the exact moment when the crash occured by manipulating the coredump file. Since it is only a memory snapshot and the program is not running anymore, we cannot step through the code by using GDB commands such as continue or step but we can print variables that are in scope.
I have already demonstrated one way of finding and resolving the root cause of the segmentation fault in this post in this particular case and we know what the causes it. That is why I will take a different approach this time for demonstration purposes.
I will define custom commands in order to ease printing elements of the singly linked list we are working here with. Let’s backtrace the program execution a bit and define the command that will print out elements of our list:

where slh_first and sle_next allude to the following macros as described in sys/queue.h:
SLIST_ENTRY(name) next- this macro creates a structure containing a pointer calledsle_next(“singly linked entry next”) pointing to the next nodeSLIST_HEAD(name_list, name) name_list- this macro creates the list head that contains a pointer calledslh_first(“singly linked head first”) which points to the first element of the list
Even though this is quite telling and enough to make conclusions if you were to look under the hood of the word_list and linked_list.c, I will lay out additional considerations that might be useful in pinpointing the exact root cause of the segmentation fault.
Additional considerations
Even though running the coredump GDB points you to the exact function in the source code where the crash occured, the assembly view of the memory, as well as examining the state of the CPU registers can provide additional useful information that can help us in backtracing the root cause of the segmentation fault.
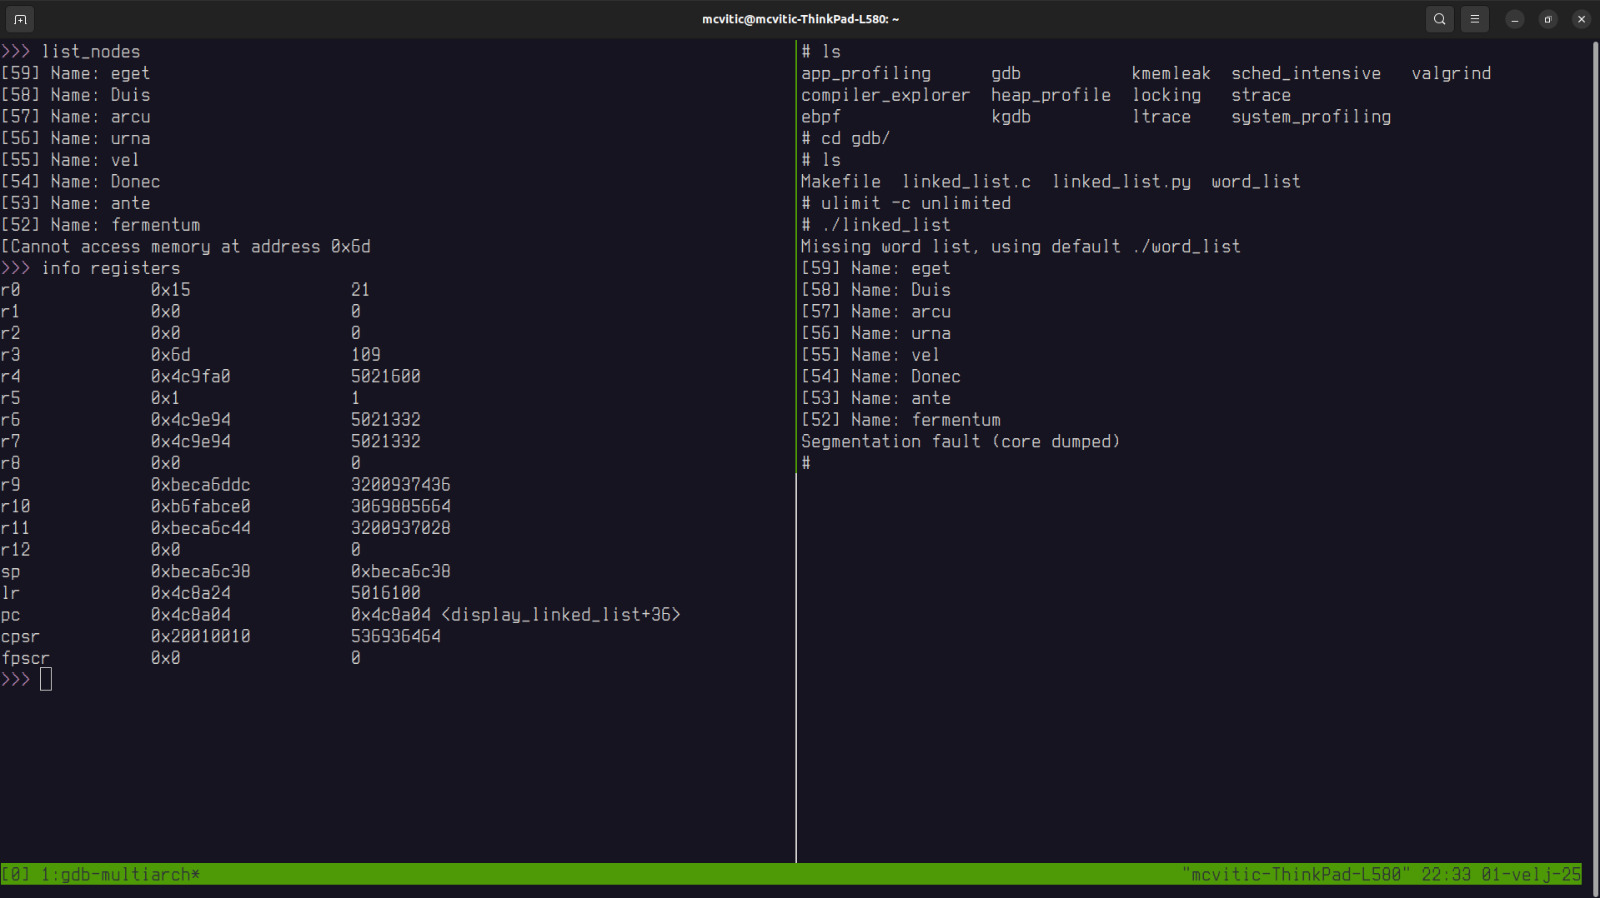
To print the state of the registers at the moment of crash, run info registers:

Based on the pc (program counter) register value, we can conclude where the execution has stopped - 36 bytes into the display_linked_list() function.
Based on the lr (link register) register value, which holds the reutrn address, we can conclude that display_linked_list() was still executing when the appliction crashed.
Based on the r2 register value, which in this case stores function arguments, we can see that it equals to ASCII ’m' indicating that overflowing occurs at the ’m' character of the word “fermentum” as concluded in the previous post.
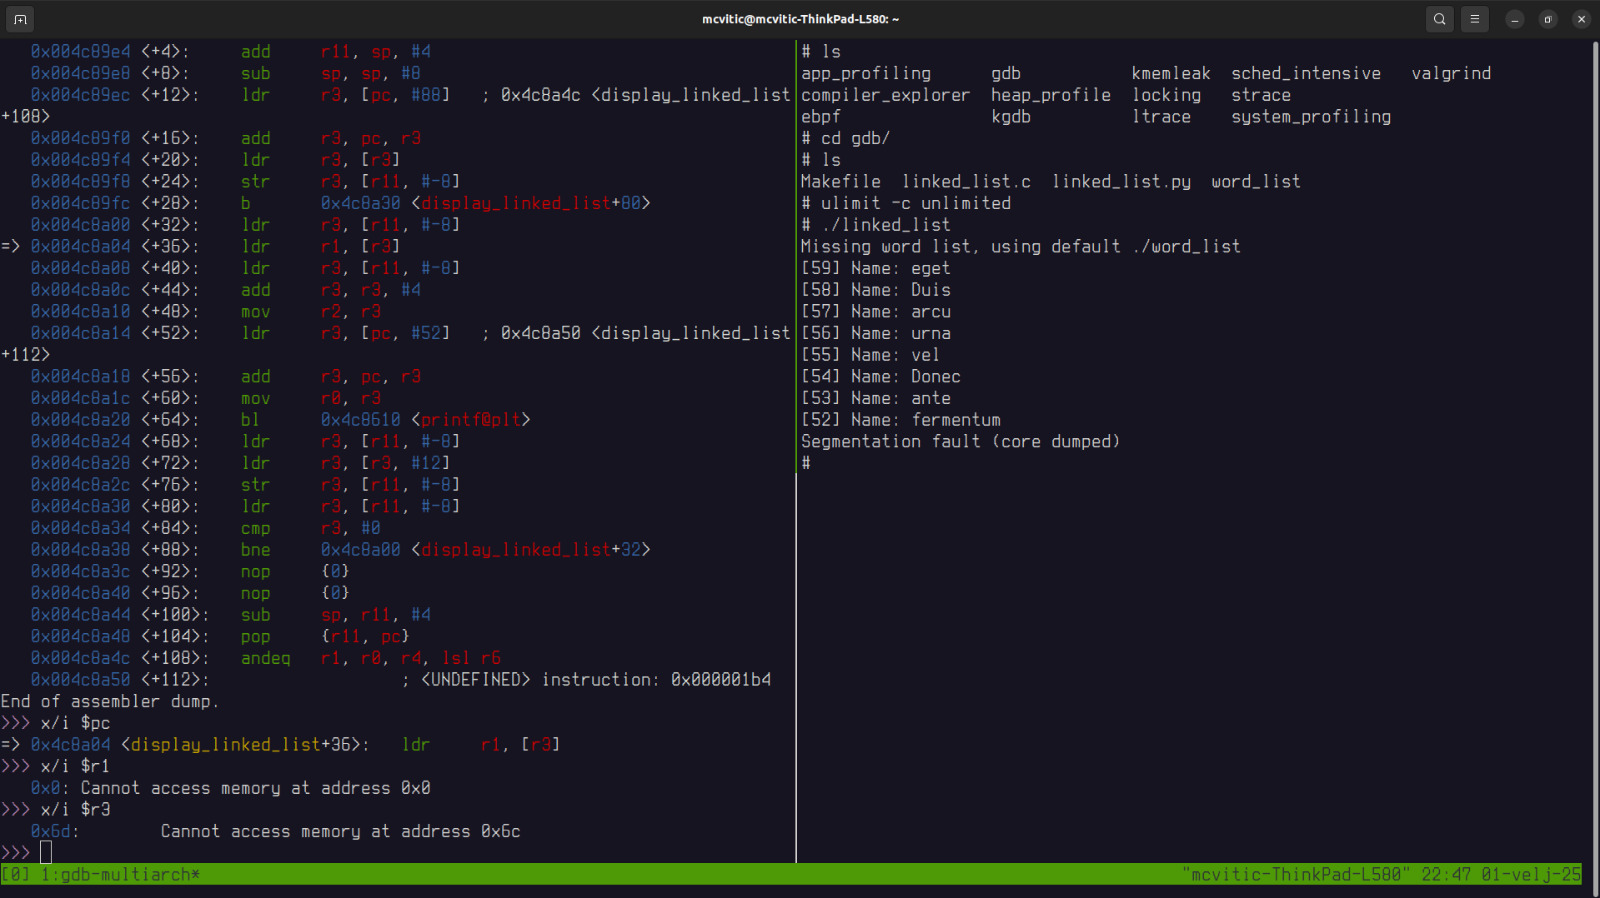
To access the assembly view of the function where the crash occured (i.e. display_linked_list()), run dissasemble display_linked_list:

0x4c8a04 <display_linked_list+36>: ldr r1, [r3] indicates that the CPU is trying to dereference the memory address stored in ‘r3’ register.
When we examine the value stored in register r3, we get familiar feedback: Cannot access memory at address 0x6c which is a suspiciously low memory address where no user-defined variables should reside indicating that an invalid pointer dereferencing might have occurred. And it did.
If you would like to support the work I do, consider donating here.