I used GDB on my host machine to detect root cause of a segmentation fault on the STM32MP157D-DK1 (I am using gdb-dashboard here btw):

In this post, I will not be focusing on giving a detailed tutorial on how to solve Bootlin’s debugging lab but rather present how I approached solving a crash caused by a segmentation fault and how I detected and fixed the source code snippet that caused the segmentation fault.
Table of Contents
Introduction
To demonstrate how to solve an application crash caused by a segmentation fault, I will be using source code that Bootlin provided for their Linux debugging, profiling, tracing and performance analysis training which I highly recommend you check out. Before continuing, I would like to express my gratitude towards everyone responsible for making Bootlin happen. I really appreciate their desire to contribute to the world of embedded Linux and that they keep their materials free and open source. Kudos!
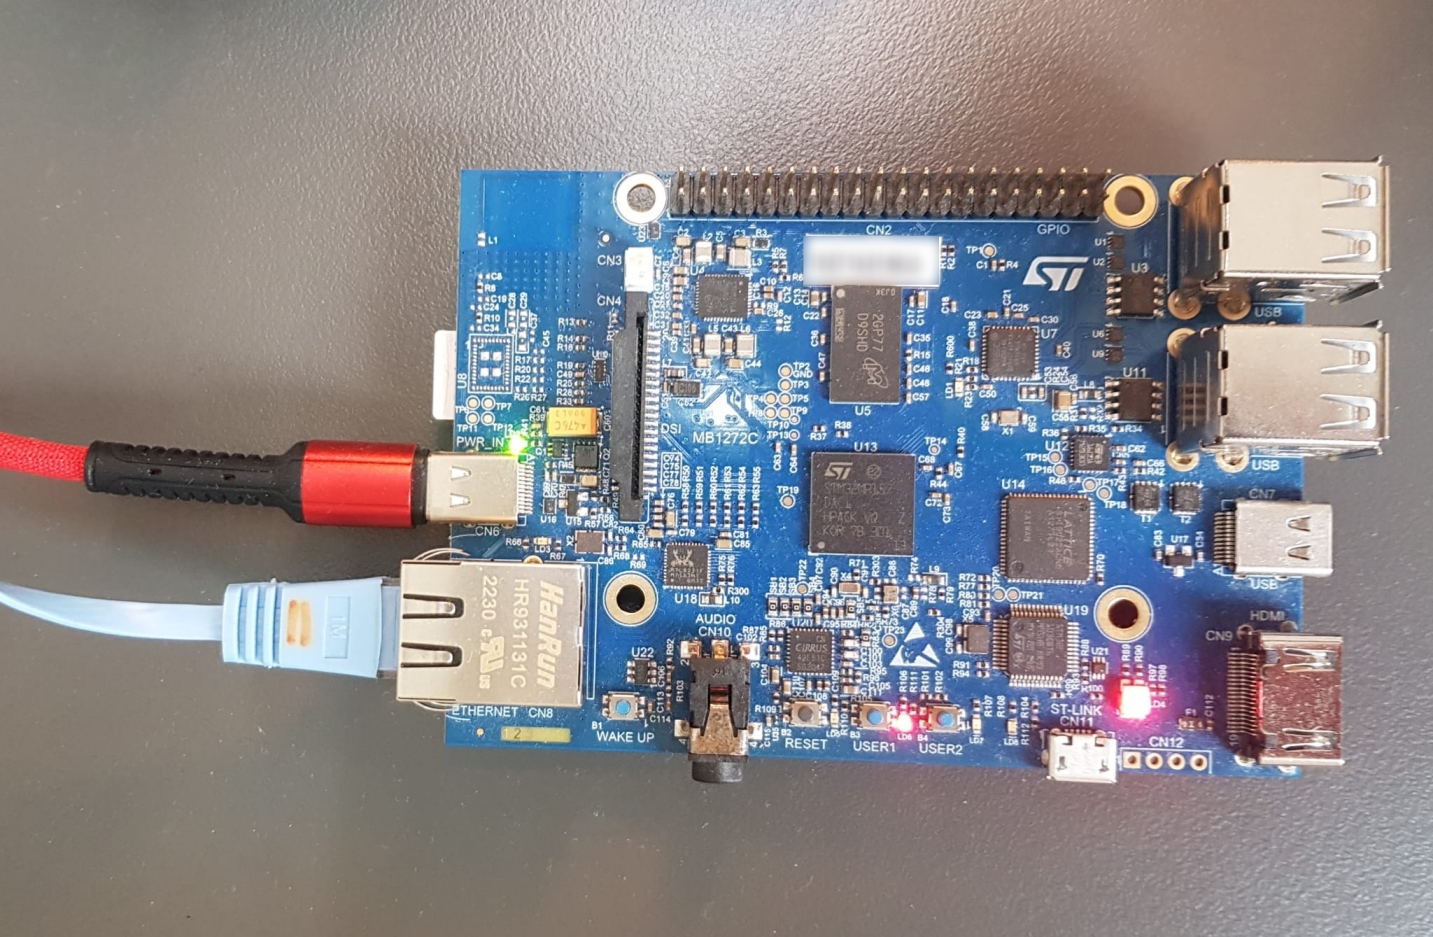
Also, here is a picture of the STM32MP157D-DK1 I was working with:
Reproducing the segmentation fault
If you haven’t read GDB setup for debugging embedded applications, I advise you to read it so you get a better understanding of what will be laid out in the rest of this blog post.
On your host machine, make sure you prepare the current shell for cross-compiling by running:
$ export CROSS_COMPILE=/home/$USER/debugging-labs/buildroot/output/host/bin/arm-linux-
Then, run make in the nfsroot/root/gdb directory to build the linked_list binary. Now, if you run linked_list on your target, you will get a segmentation fault:
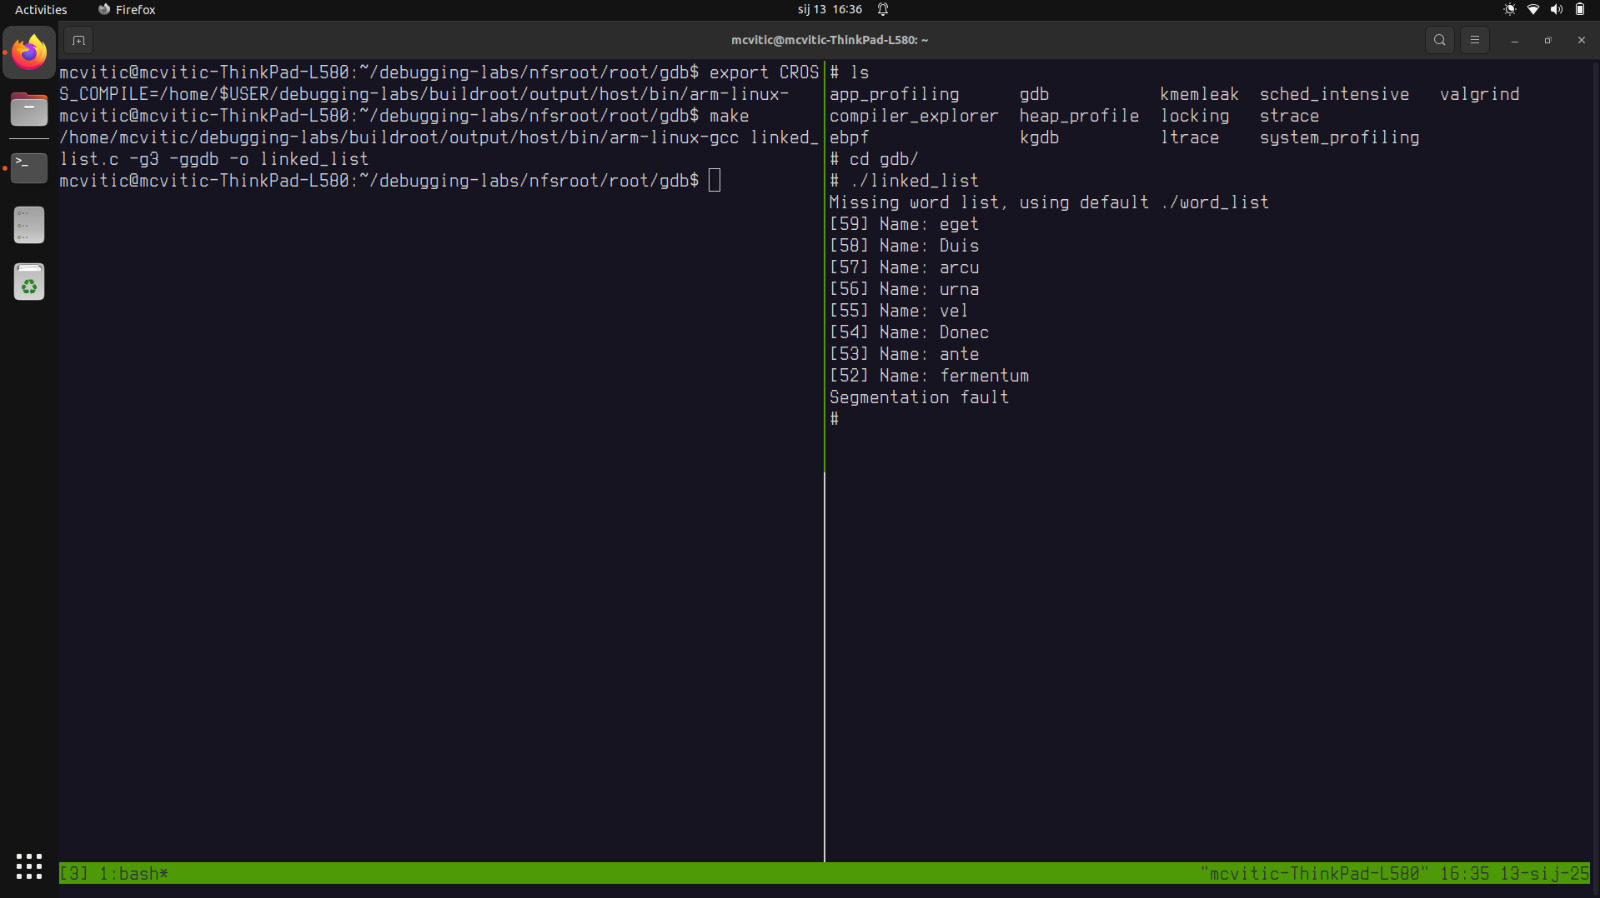
Generally, a segmentation fault indicates that a program attempted to access a memory location that it was not allowed to access. That means that one of the following scenarios is the root cause of the application crash we trying to resolve:
- access violation
- reading or writing to an invalid memory address such as a null pointer, an uninitialized pointer, a pointer to a memory address that has been freed or is out of scope, an out-of-bounds array index
- improper memory usage
- recursive function calls can exhaust the stack memory causing it to overflow
- improper use of dynamic memory allocation or deallocation like using
freemultiple times on the same memory block or writing beyond the allocated memory causes heap corruption - attempting to access data at an address not aligned to the data type’s requirements like reading a 4-byte integer from a 3-byte aligned address
- logic error occurence in the source code
- dereferencing a pointer before it has been properly initialized (i.e. dereferencing a null pointer)
- passing invalid pointers to functions
Setting up the debug environment
As hinted at in the beginning of this blog post, we will be using a remote GDB setup since our target does not embed a fully featured GDB, but only a gdbserver that allows connecting with a remote fully featured version of GDB that we have running on our host machine.
Let’s start our program on the target by using gdbserver in multi mode:
# gdbserver --multi :2000 ./linked_list
On the host side use gdb-multiarch to attach to the process on the target:
$ gdb-multiarch ./linked_list
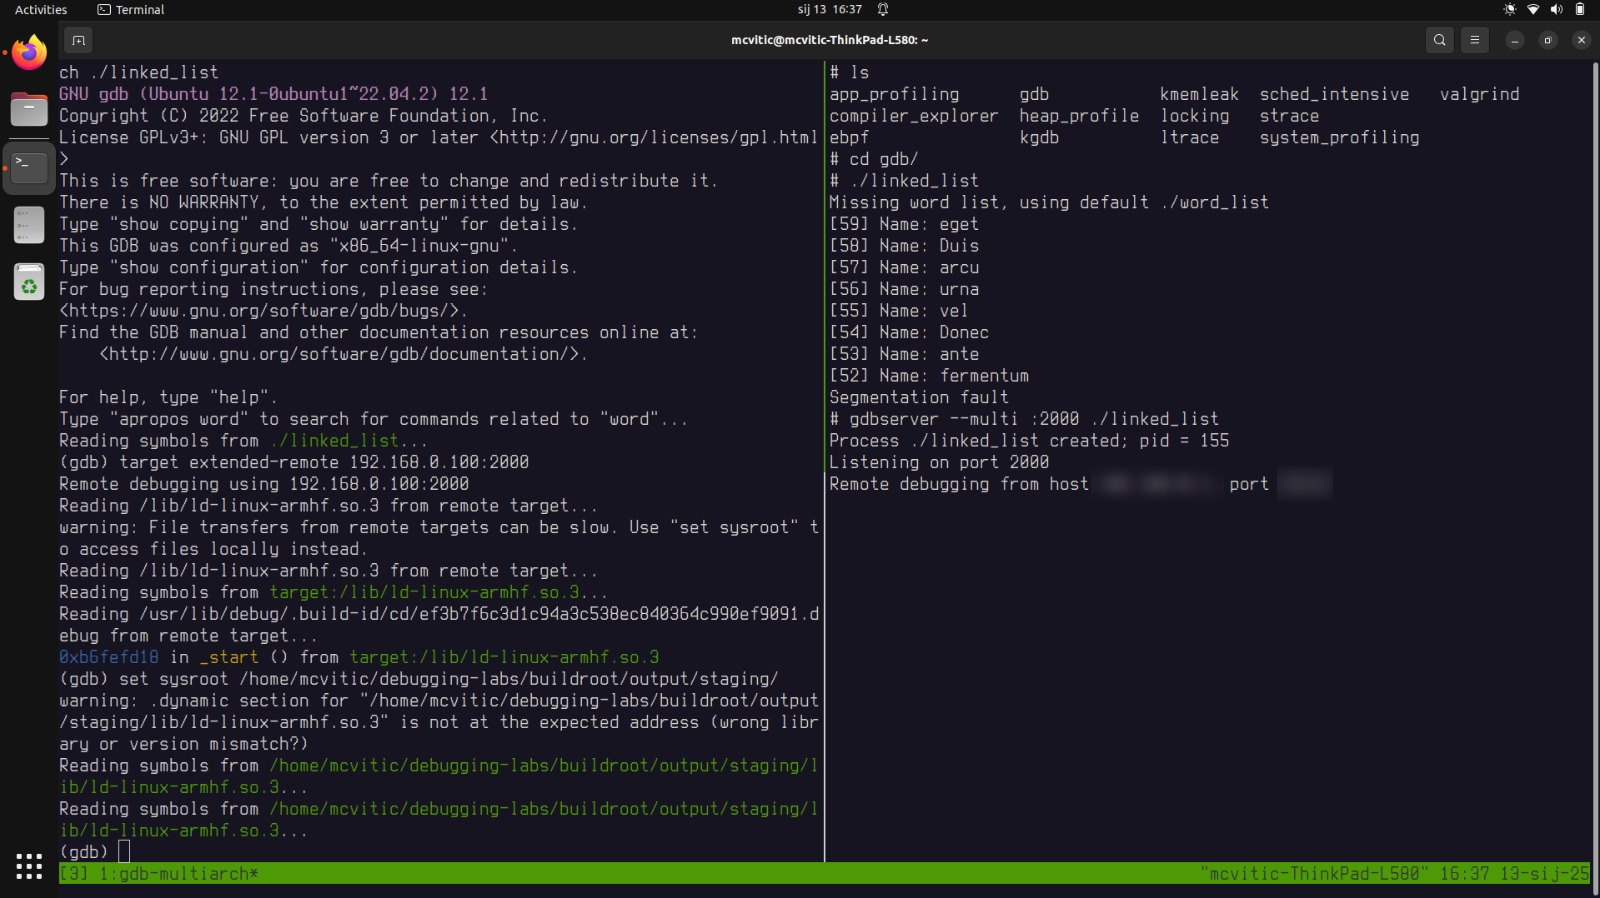
when in gdb, enter the following:
(gdb) target extended-remote 192.168.0.100:2000
(gdb) set sysroot /home/<user>/debugging-labs/buildroot/output/staging/
You can now enter the TUI either by ctrl + x + a or by typing lay next and hitting enter a couple of times until you see the source code, assembly view and the GDB console:

NOTE: Besides GDB TUI, there are several other user interfaces with debugging options such as gdbgui and gdb-dashboard which I will be using the most from the next blog post onwards.
Application debugging
The first thing I recommend doing is setting a breakpoint in the main function so you can see where exactly the segfault occurs when you backtrace it after the program has crashed:
(gdb) break main
Then, run the program to reach the breakpoint at the main function and continue execution until the crash occurs:
(gdb) run
(gdb) continue
Once the program segfaults, show the backtrace to pinpoint the function that causes the segfault:
(gdb) backtrace
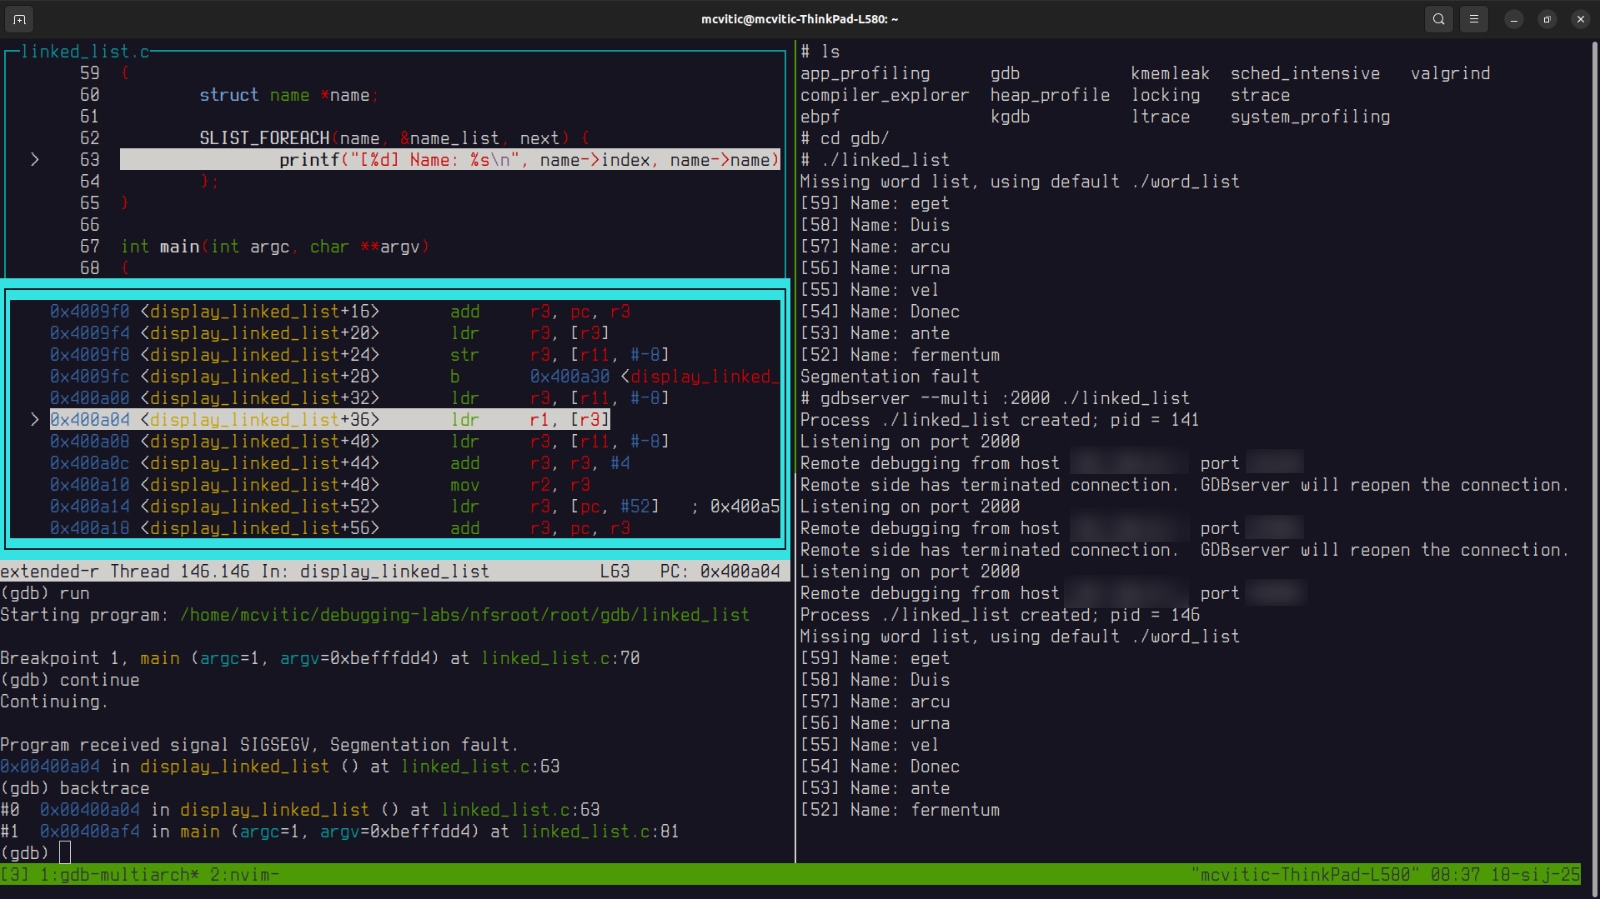 As you can see, the line causing the crash in the main program is located in the linked_list.c at 81. Add the breakpoint to that line:
(gdb) break linked_list.c:81
Restart the program in GDB by running start or run. You will reach the main function again since this is the first breakpoint we set and then run continue until you reach the function causing the problem which is display_linked_list(). Enter step to enter this function.
A very useful GDB command in this case is print which is used to print variables inthe current scope:
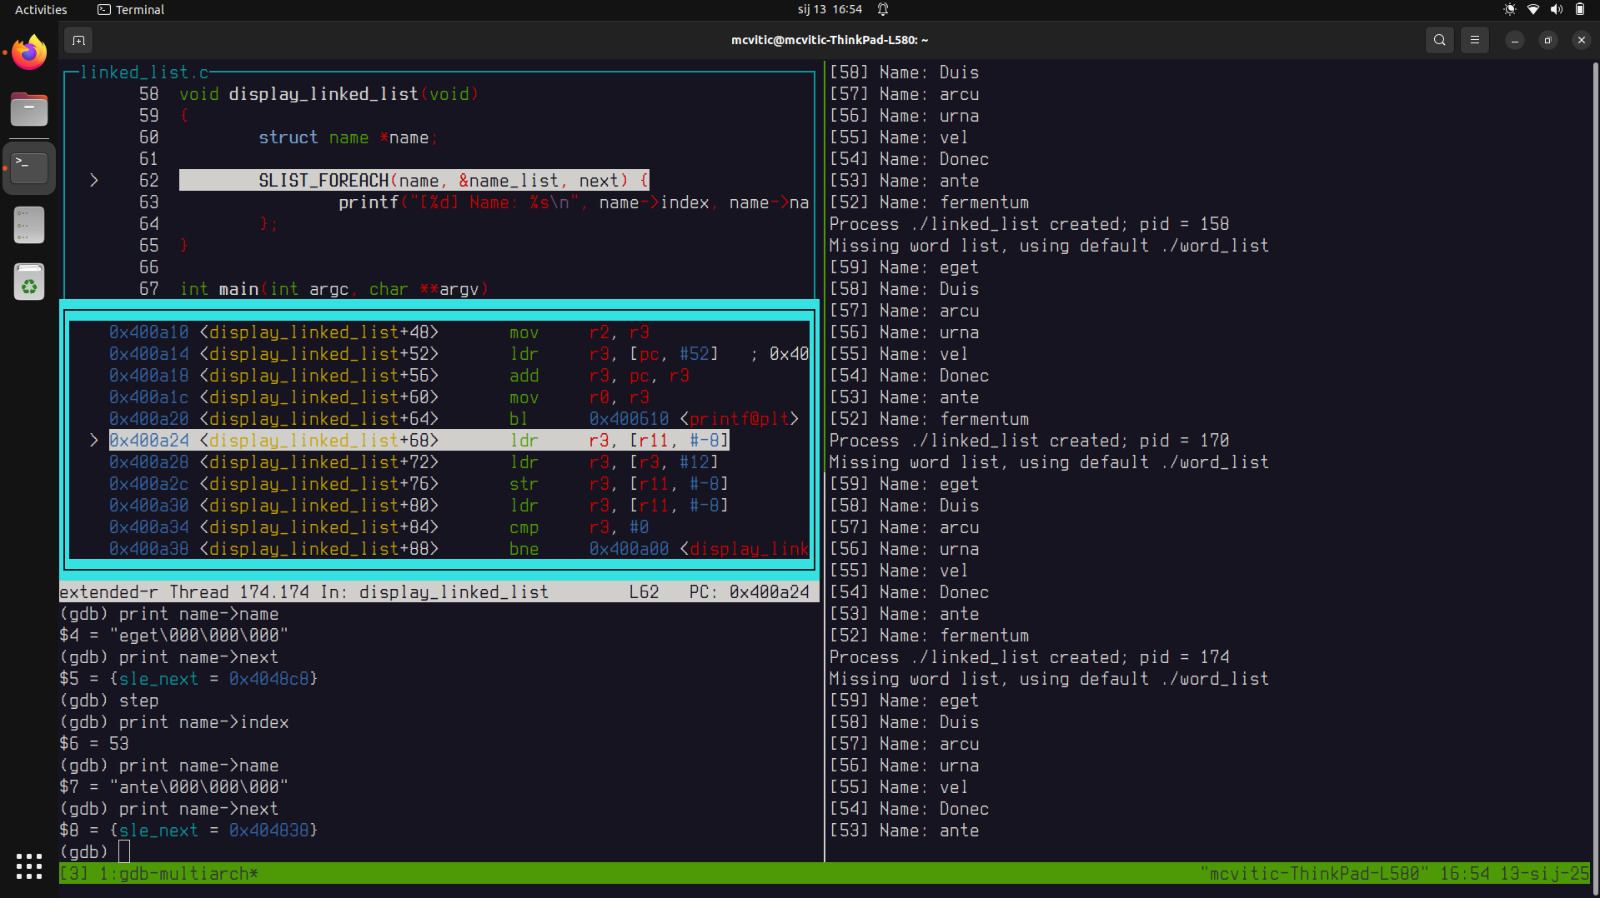
You can see strings being printed line after line in the target machine’s console. Stepping and printing will give you a glimpse of how the function is being executed sequentially. For education and demonstration purposes, feel free to step through every entry of the word list until you reach the segfault. Generally, if typing the same command becomes way too repetitive way too quickly, consider using conditional breakpoints.
When you reach the last entry being printed, notice the difference between what is being shown in the GDB console and on the target machine’s console. One says “fermentu” and the other “fermentum”. This should raise an eyebrow…
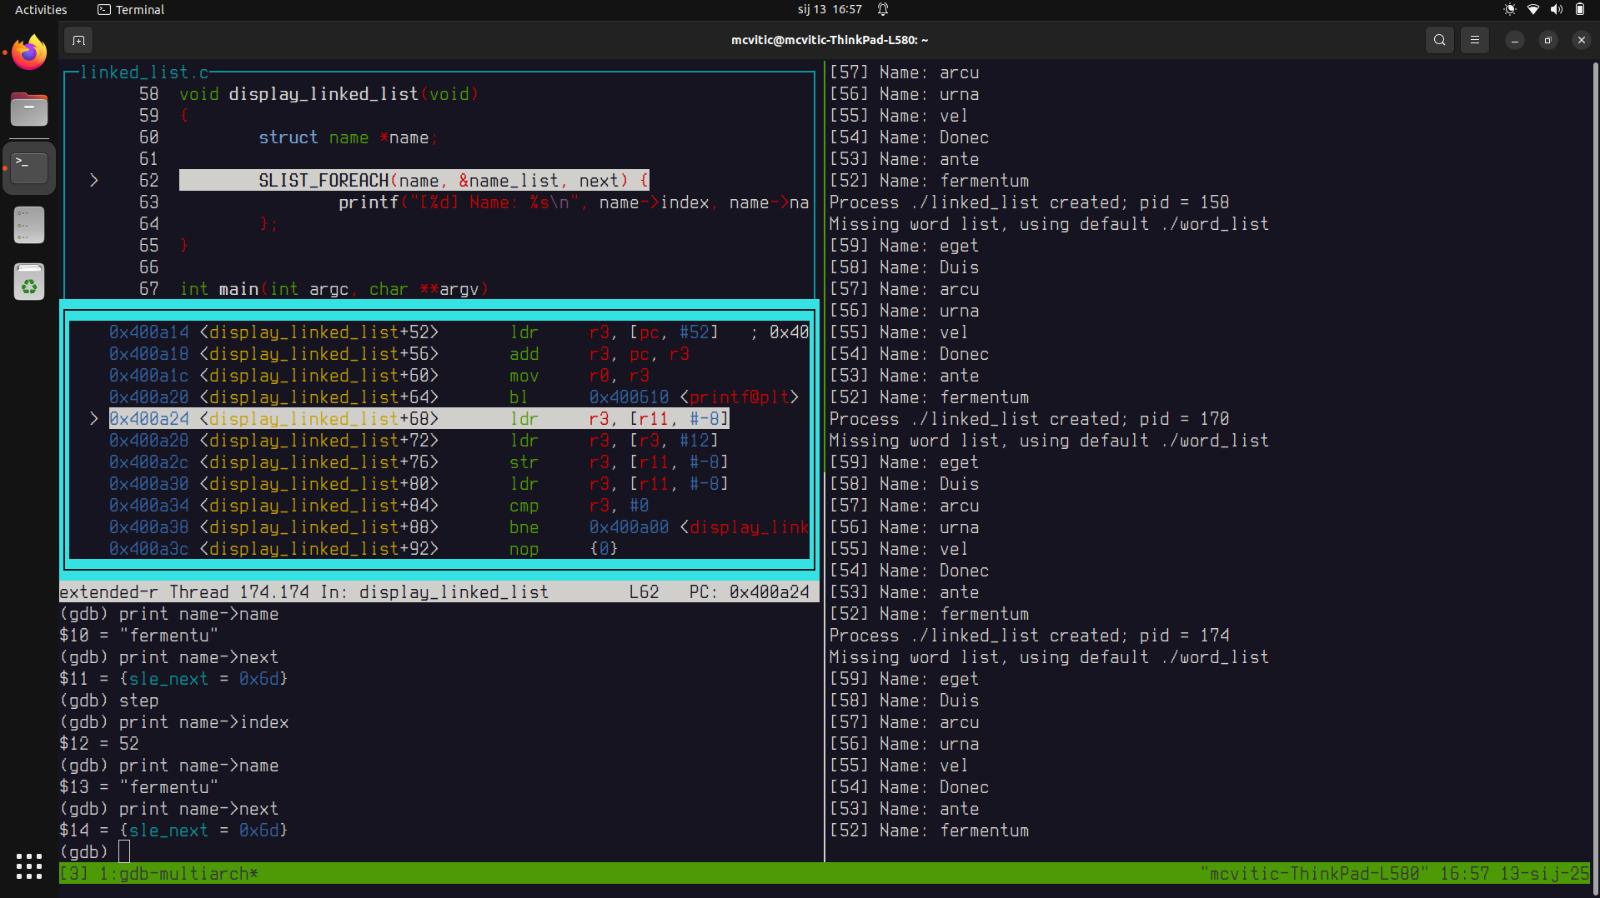
If you now step and try printing the next entry in the linked list, you will see that you are pointing to an address you cannot access which is causing the segmentation fault:

Now, if you take a look at the name struct in linked_list.c you will see that it has a member name which is an array of 8 characters:
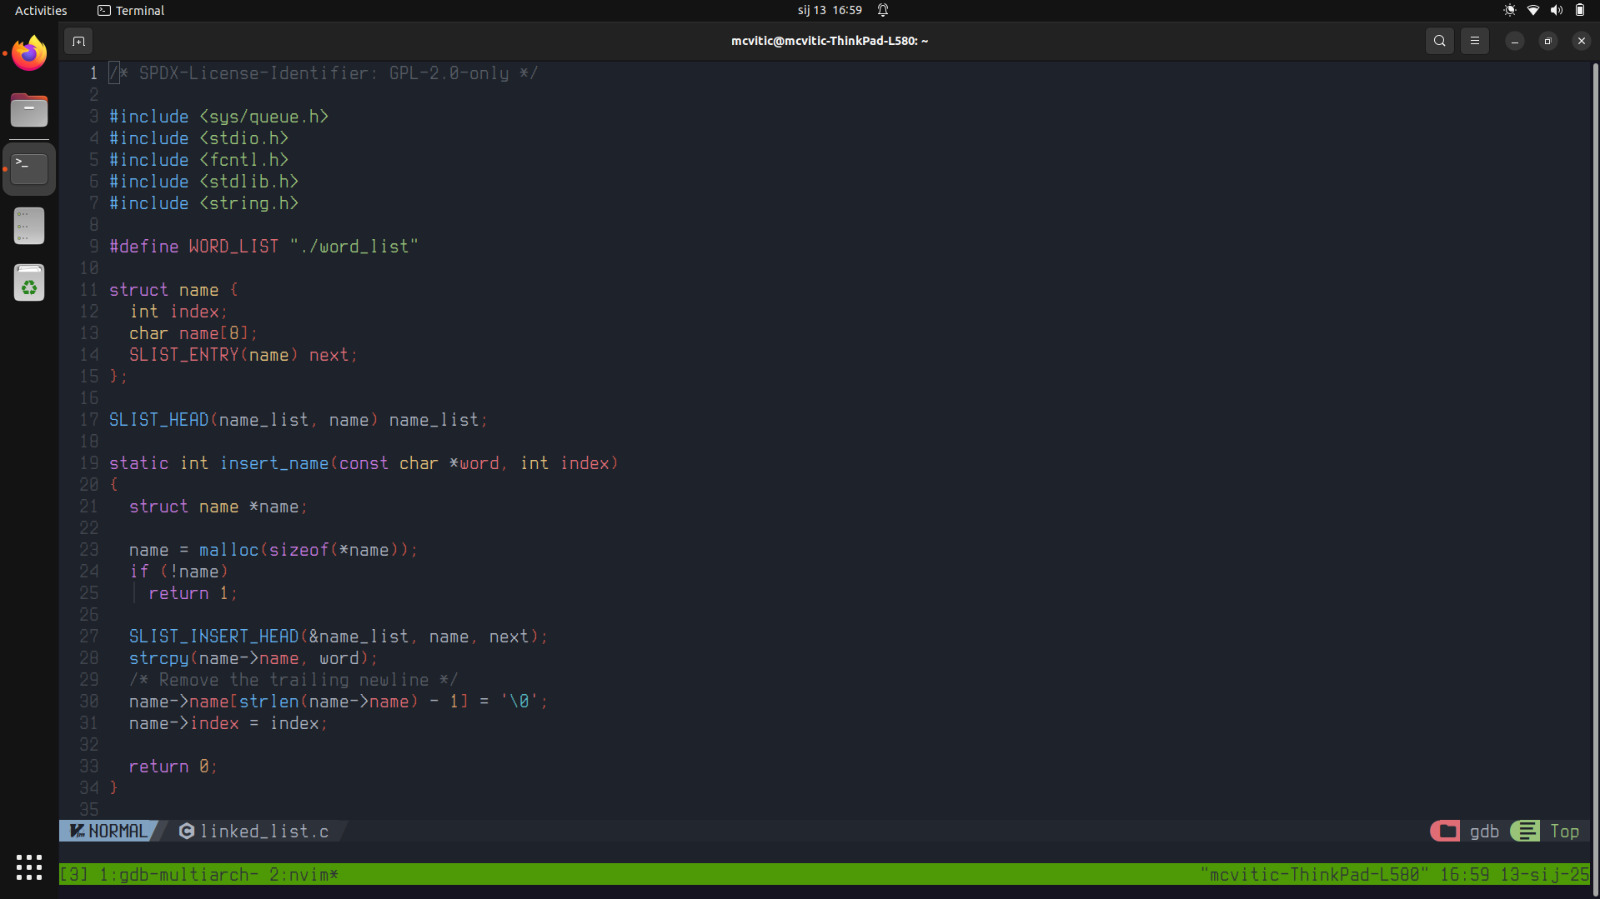
And “fermentum” has 9 characters…eureka! The program is trying to display a word of 9 characters when it only has 8 character slots for a given entry from the word list. That is the reason why the program segfaults.
There are more intelligent ways of solving this problem but I will propose the simplest and quickest one. I looked at the world list being printed and none of the words contain more than 20 characters. Let’s change char name[8] to char name [20] and recompile the program. Now, we run the program we can see it execute correctly. Awesome!
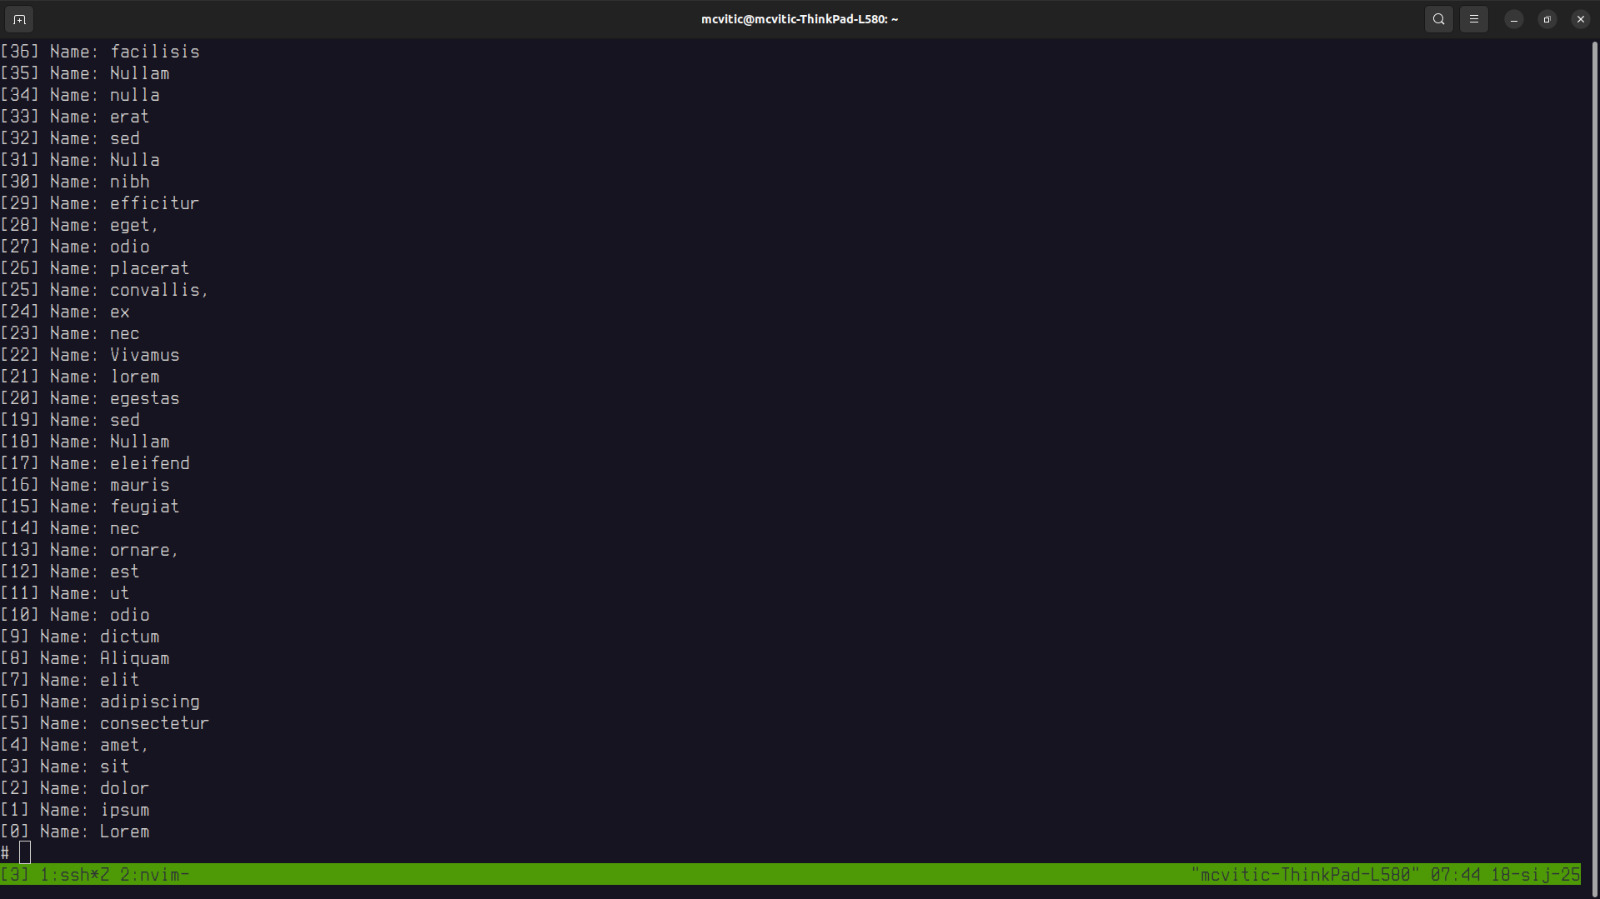
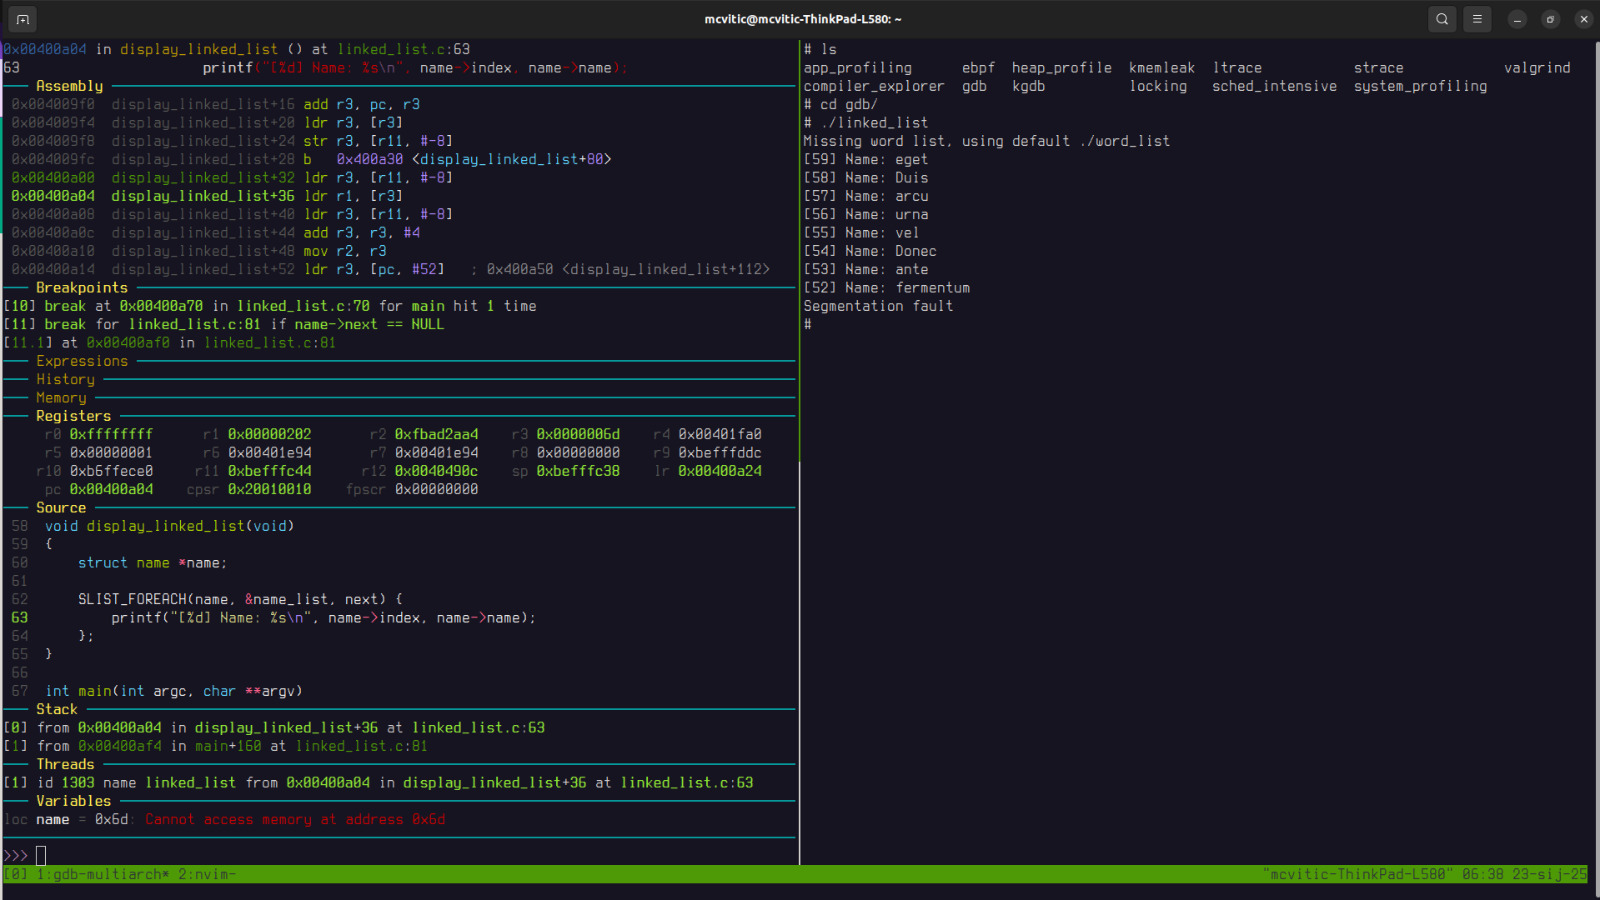
As stated earlier, conditional breakpoints may provide a more elegant way of solving segmentation faults, especially when some parts of code are iterative in nature. In order to set a breakpoint when the pointer to the next element of the linked list is nonexistent, do the following:

Restarting the application in GDB will now result in:
Summary
There are many ways to go about solving an application crash on an embedded device, and this is one of them. In general, you want to consider the following:
- compile you application with debug symbols (g3, ggdb if necessary)
- establish connection between the development host and the target machine (via SSH or serial communication)
- create a breakpoint in the main function and let it run to provoke the segmentation fault and use backtracing to pinpoint the function causing where the fault occurs
- add new breakpoint to that function
- run the program again and continue execution until you reach the newly added breakpoint and step into the function where the fault occurs
- modify the source code, recompile it and run your faultfree application!
If you would like to support the work I do, consider donating here.