In this blog post, I will explain how I used strace to analyze an application for which I didn’t have the access to the source code:
Table of Contents
- Introduction
- What is a syscall?
- Making sense of the output
- Application’s
straceoutput analysis - Summary
- Conclusion
Introduction
In this blog post, I will be using the same setup as described in the GDB setup for debugging embedded applications blog post. As always, special thanks to Bootlin for providing the source code.
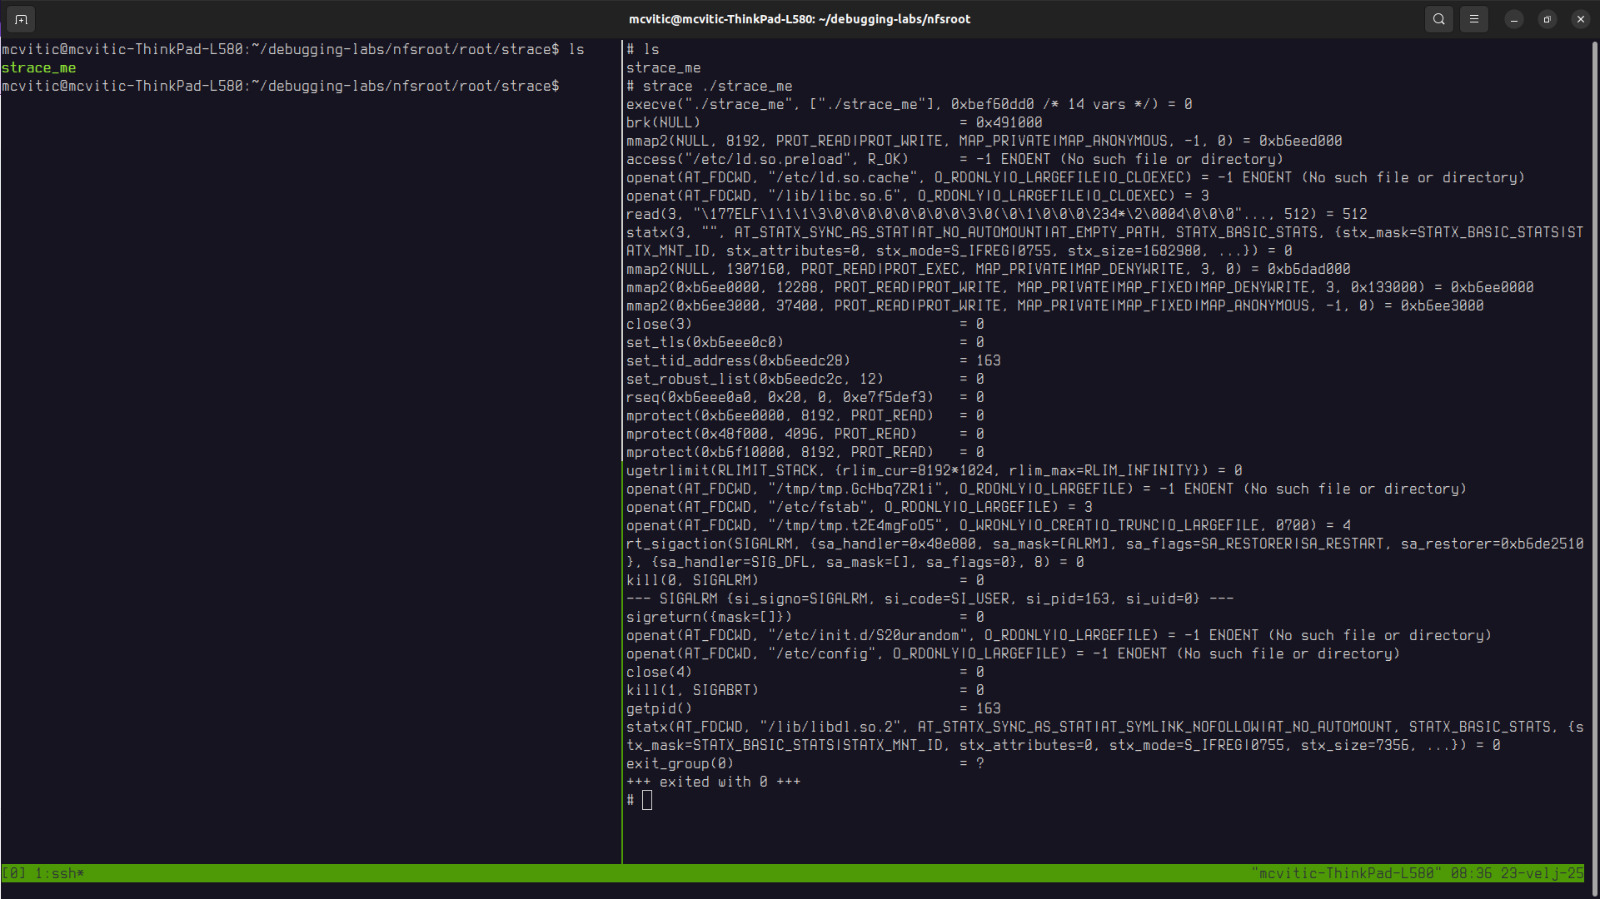
In order to see which system calls strace_me application invokes, run the following in the nfsroot/root/strace directory and observe the output as shown in the figure below:
$ strace ./strace_me
Before making sense of the output, let’s see what syscalls actually are.
What is a syscall?
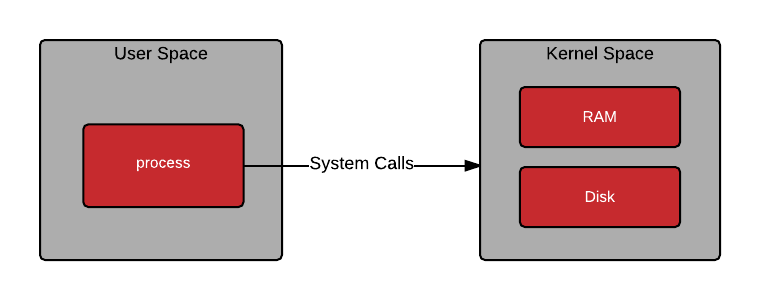
A system call (or just simply, “syscall”) is a special type of a call that an application makes to the operating system’s kernel in order to communicate with it. This is depicted in the following figure I found on Red Hat’s blog:
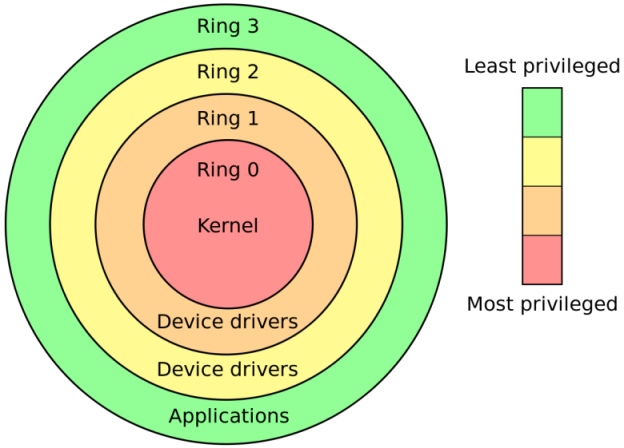
Applications live in the so called “userspace” and the kernel lives in the “kernelspace” which means that they reside in different protection rings due to the nature and consequences of operations in the respective spaces as depicted in this figure I found on stack overflow:
For example, a program can do a wide variety of things in the userspace like calculating complex math or manipulating data structures, but if it wants do anything with the network or the filesystem for example, it has to talk to the kernel and in order for the application to communicate with the kernel, As noted earlier, syscalls can be traced with a tool called strace which was used to trace syscalls that strace_me application has made.
NOTE: There is also an “inverse” of this communication userspace->kernelspace communication so to speak called signals which the kernel uses to send information to userspace applications. Signals are asynchronous software interrupts that notify a process about some events. A process is a running instance of an application in this case. It is created when you run strace_me application which in turn enables the kernel to send signals to strace_me.
Making sense of the output
Generally, everything up until openat() command is generally just application initialization. The real work of the application begins with the openat() which passes the path to the file which we want to open along with some other options.
Make sure to check the file descriptor after the equals sign. The following are taken by:
- 0 -> stdin
- 1 -> stdout
- 2 -> stderr
- 3 -> anything else
Before diving deeper, focus on two calls as they are usually most telling of what the application effectively does:
- openat()
- read()
To see this in action, use grep to see which files did the strace_me application open:
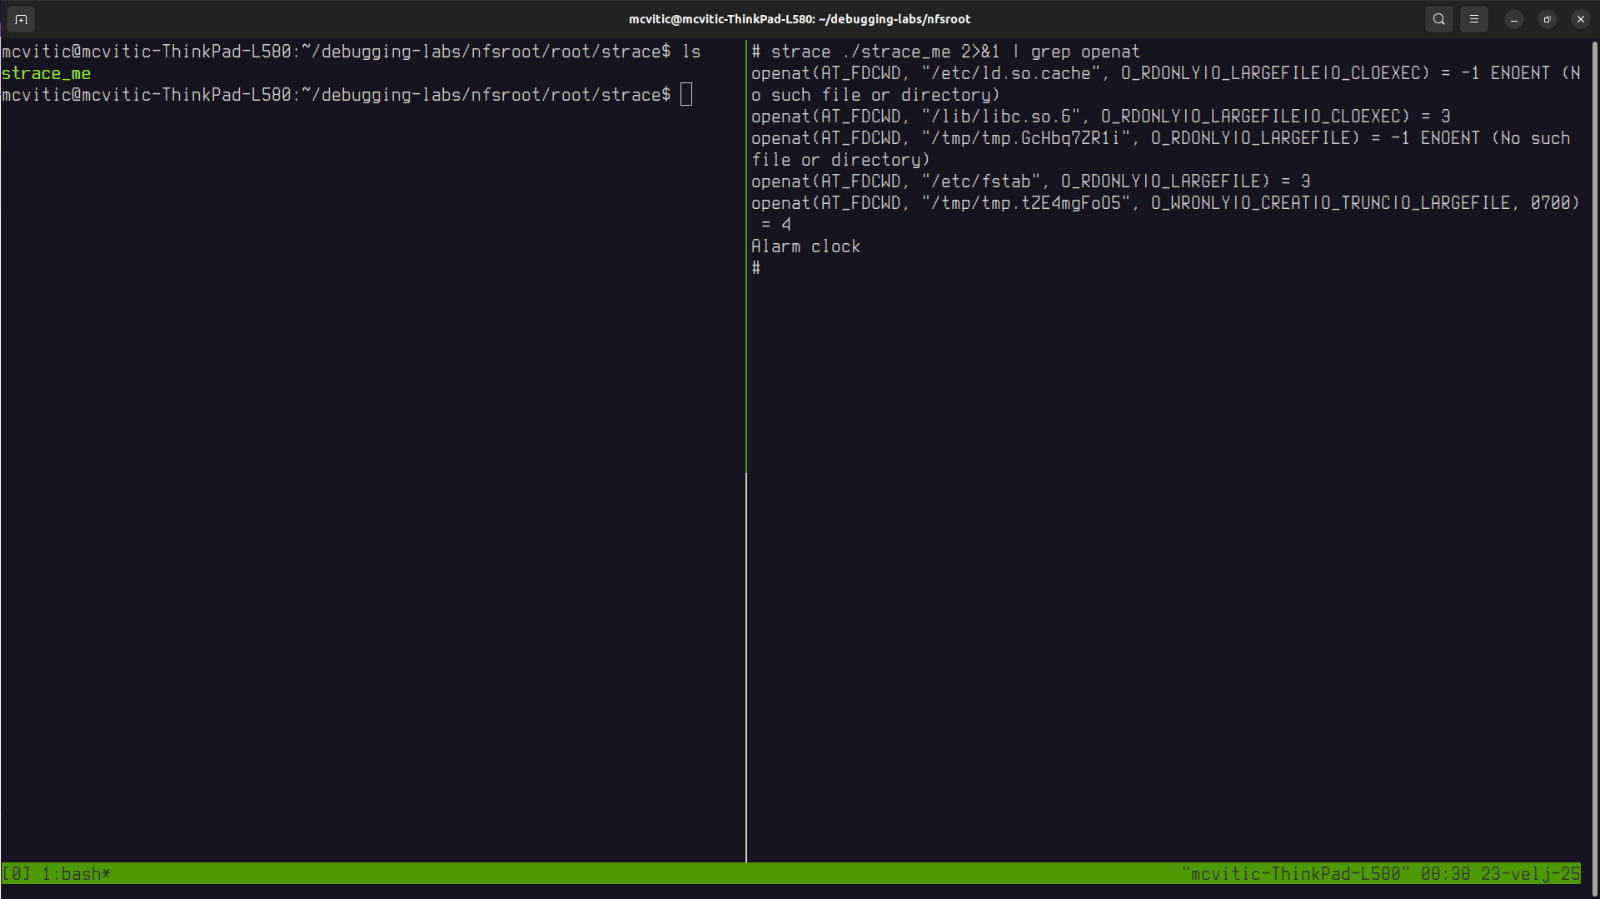
I also used grep to see what was being read() and how may times was it called:
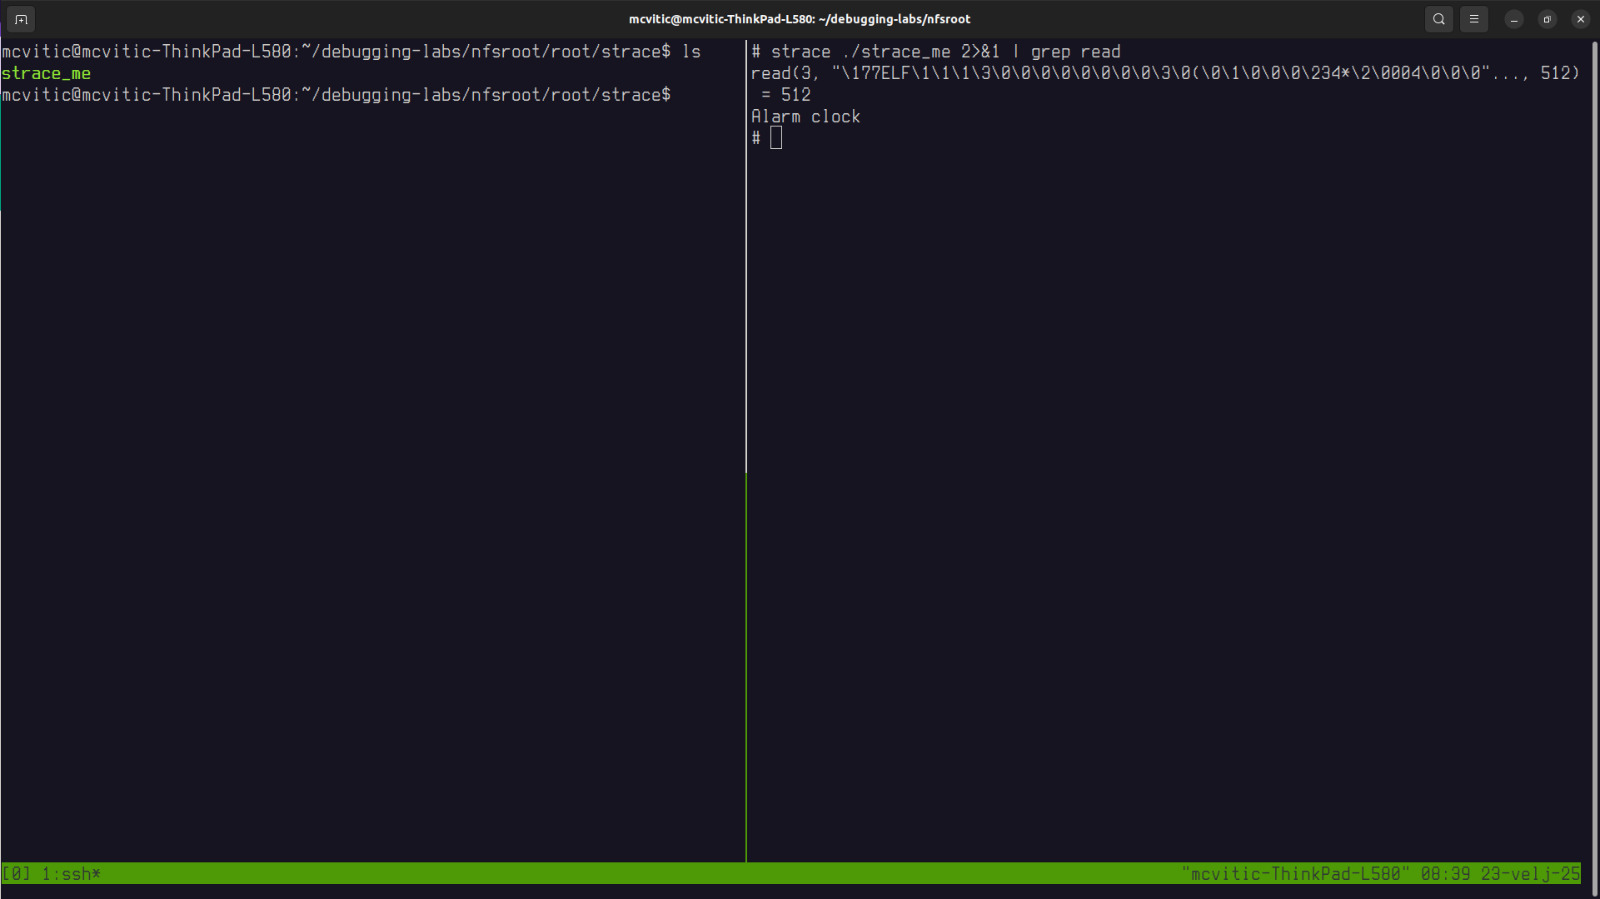
NOTE: The 2>&1 part of the strace command is used to redirect standard error stderr(2) to standard output stdout(1) because strace outputs syscalls to the stderr, not to stdout and grep searches lines only in stdout.
Application’s strace output analysis
Process execution
The first line that can be seen from the output is the system call that starts the strace_me binary. The return value of 0 indicates successful execution:
execve("./strace_me", ["./strace_me"], 0xbfef60d8 /* 14 vars */) = 0
Memory management
Next three lines are used for memory allocation:
brk(NULL) = 0x491000
mmap2(NULL, 8192, PROT_READ|PROT_WRITE, MAP_PRIVATE|MAP_ANONYMOUS, -1, 0) = 0xb6eed000
mprotect(0xb6ebf000, 8192, PROT_READ) = 0
brk(NULL) checks the program break (heap start), while mmap2(...), the application allocates 8KB of anonymous private memory, most likely for stack or heap. Finally, mprotect(...) sets memory permissions by making a region read-only.
Filesystem access
Next two lines:
access("/etc/ld.so.preload", R_OK) = -1 ENOENT (No such file or directory)
openat(AT_FDCWD, "/etc/ld.so.cache", O_RDONLY|O_LARGEFILE|O_CLOEXEC) = -1 ENOENT (No such file or directory)
indicate that there is no custom shared library preloading and that no pre-cached library paths were found, meaning ld.so has to search directories manually.
The following line:
openat(AT_FDCWD, "/etc/fstab", O_RDONLY|O_LARGEFILE) = 3
indicates that strace_me successfully opened the /etc/fstab file which contains filesystem mount information.
This line:
openat(AT_FDCWD, "/tmp/tmp.GchbQ27l", O_RDONLY|O_LARGEFILE) = -1 ENOENT (No such file or directory)
indicates that the application tries to open a temporary file called tmp.GchbQ27l but fails.
The following lines:
rt_sigaction(SIGALRM, {sa_handler=SIG_DFL, sa_mask=[], sa_flags=0}, {sa_handler=SIG_DFL, sa_mask=[], sa_flags=SA_RESTORER|SA_RESTART, sa_restorer=0xb6de2510}, 8) = 0
kill(0, SIGALRM) = 0
are used by strace_me to set a signal handler for SIGALRM and keep it at default behavior with SIG_DFL flag. It then sends SIGALRM to itself (kill(0, SIGALRM)) which leads to process termination. SIGALRM is a signal that the kernel sends to the userspace program when working with timers which in turn means that strace_me is dependent upon some kind of a timer in some way.
In the end, strace_me terminates normally.
Summary
We now have enough information about strace_me to make following conlusions and assumptions:
- manages memory via
mmap2()andmprotect(), likely enforcing stack security - dynamically linked, looks for shared libraries but doesn’t preload anything
- checks system files (
/etc/fstab) - might be inspecting mounts - tries to open temp files in
/tmp/but fails - possible optional config check - sets
SIGALRMto default behavior - program will exit when it receives an alarm signal indicating some kind of a timeout
What strace_me is most likely doing
Based on the strace output, the strace_me is a test application that interacts with system files and memory. It and exits cleanly upon receiving a SIGALRM signal without doing much.
Conclusion
strace lets you trace system calls that an application makes which provides more information about how does the application interact with the system it runs on. Useful calls that provide useful information that you should have an eye on are openat() and read(). Generally, everything up until openat() syscall is basically just application initialization. Every syscall afterwards gives us more meaningful information about the application.
If you would like to support the work I do, consider donating here.