In this blog post, I will explain how I used valgrind with vgdb to detect memory errors leaks and misbehaviors: 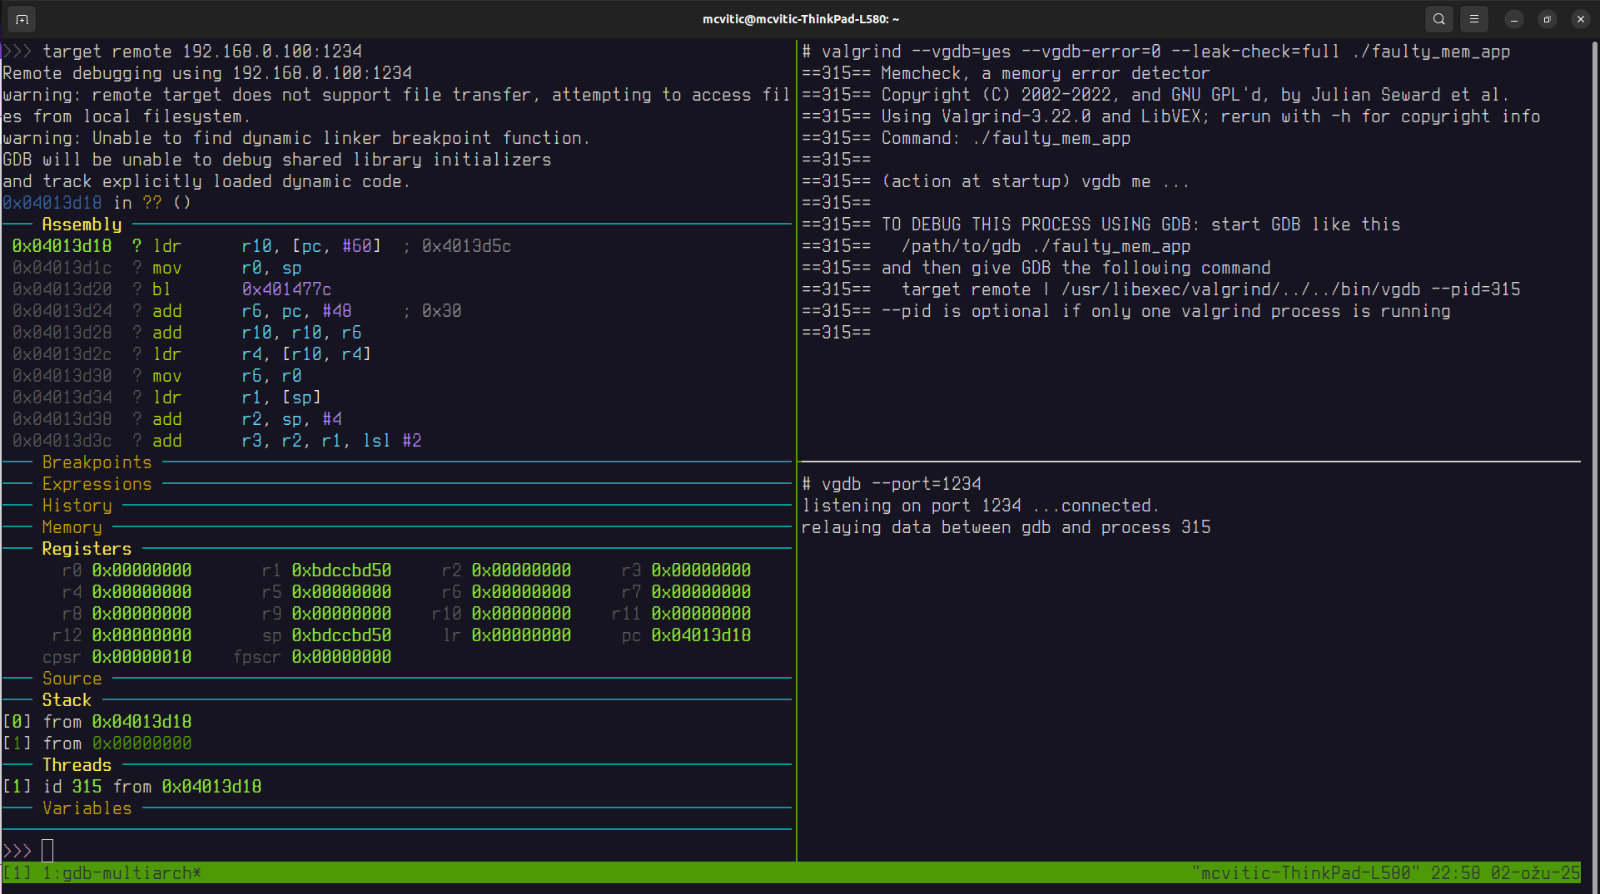
as well as address sanitizer to do the same, but quicker: 
In this post, I will not be focusing on giving a detailed tutorial on how to solve Bootlin’s debugging lab but rather present how I approached solving memory leaks of a running application and how I detected and fixed the root cause of it.
As usual, I would like to give a shout out to Bootlin for making their materials free and open source, including materials I used to demonstrate detecting and fixing memory leaks described in this blog post.
Table of Contents
Introduction
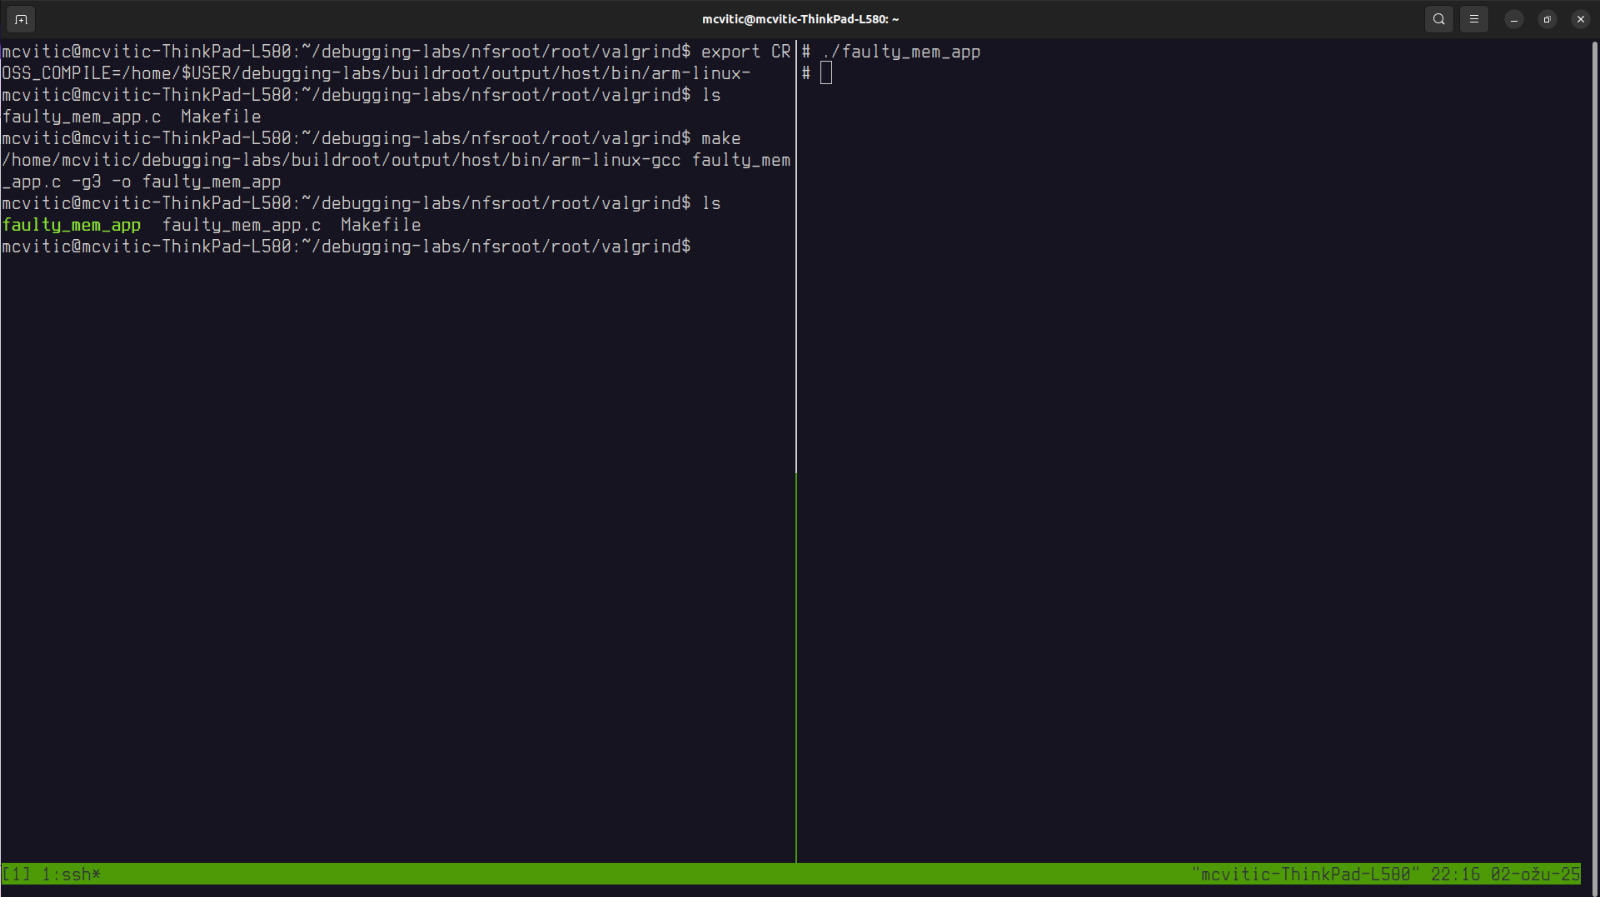
In this blog post, I will be using the same setup as described in the GDB setup for debugging embedded applications blog post. As always, special thanks to Bootlin for providing the source code.
On your development host, change directory to valgrind folder, cross-compile valgrind.c and then run it on the target:
Even though there is no segfault, an application might leak memory or perform out-of-bounds access or just simply contain uninitialized memory blocks. One useful tool to detect these “invisible” memory issues is valgrind.
Using valgrind
When we run the application again with valgrind we get the following result:
$ valgrind --leak-check=full ./faulty_mem_app
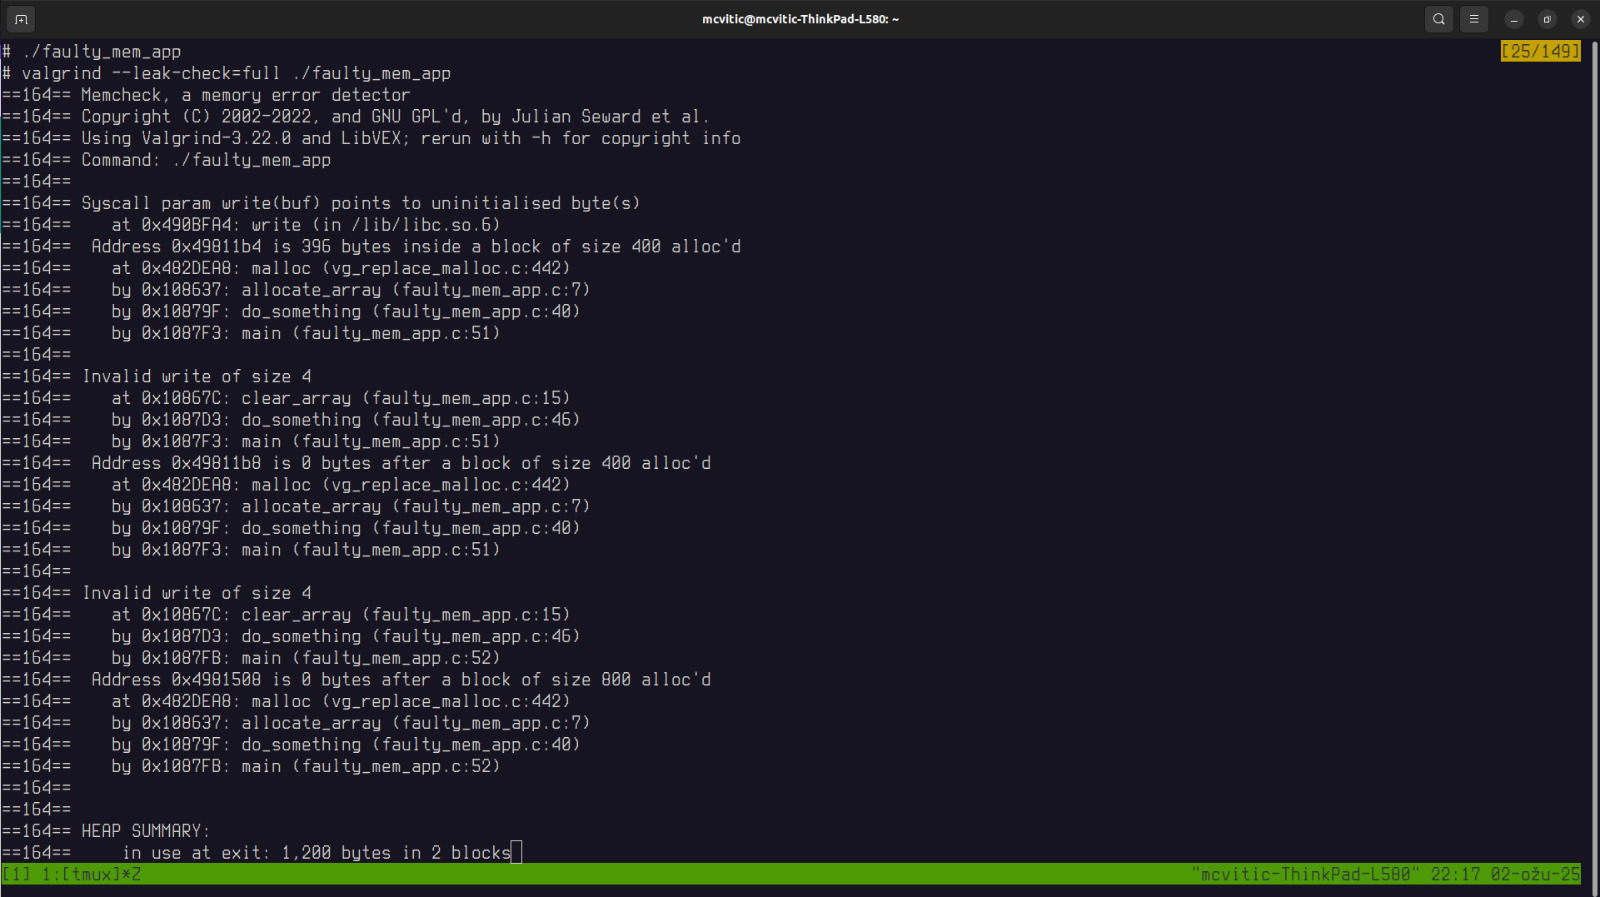
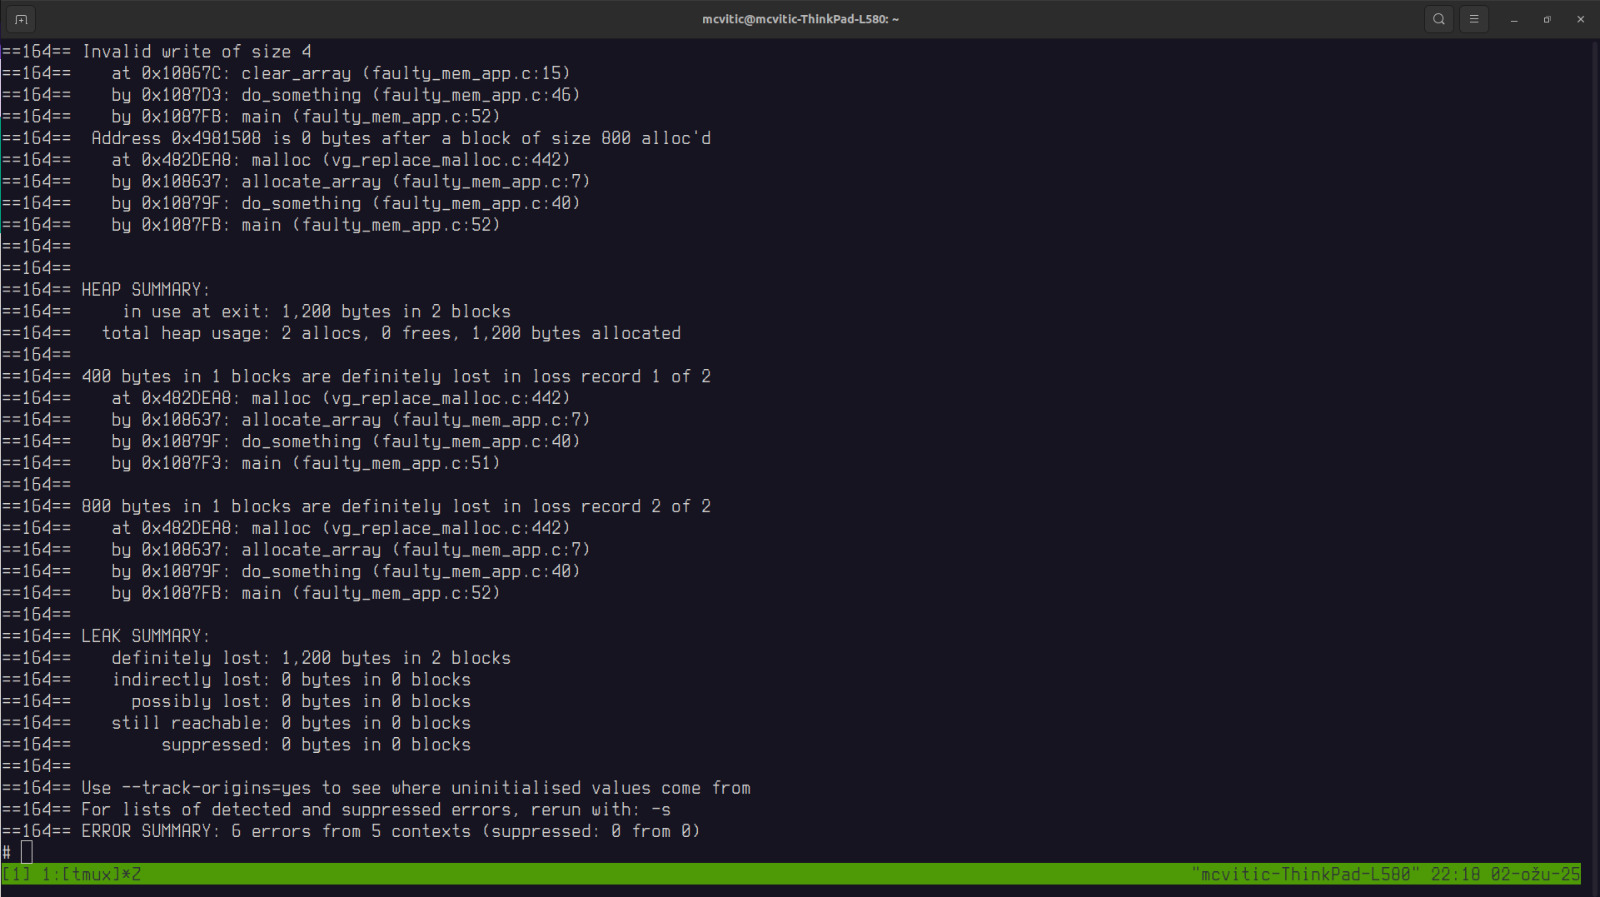
The output indicates following occurences in faulty_mem_app:
- invalid memory write
- uninitialized memory
- memory leak (memory was allocated but never freed) !slika.png
The call stack indicates the following origin and error propagation:
main() -> do_something() -> clear_array()
To fix this issue, we have to check if array access is out of bounds and that malloc() is allocating enough space. Also, this memory has to initialized before use and freed in the end.
Backtracing the call stack to pinpoint where the issue occurs will, in majority of cases, most likely be enough to solve the memory issue.
However, in order to pinpoint each error exactly dynamically and be able to debug with gdb, vgdb can be used. vgdb is a bridge that allows gdb to attach to and control a running valgrind process.
valgrind and vgdb
Using valgrind with vgdb gives us dynamic interactive control by letting us stop execution at memory errors, inspect variables, set breakpoints, and trace exact causes, whereas using plain valgrind only gives a post-mortem report.
We will do that remotely on the host using gdb-multiarch. First, run the following on the target:
$ valgrind --vgdb=yes --vgdb-error=0 --leak-check=full ./faulty_mem_app
In order to do remote debugging using vgdb, it has to be in listen mode. Start another terminal in SSH on the target and run:
# vgdb --port=1234
On the host side, run:
$ gdb-multiarch ./faulty_mem_app
and connect to vgdb using the following:
(gdb) target remote 192.168.0.100:1234
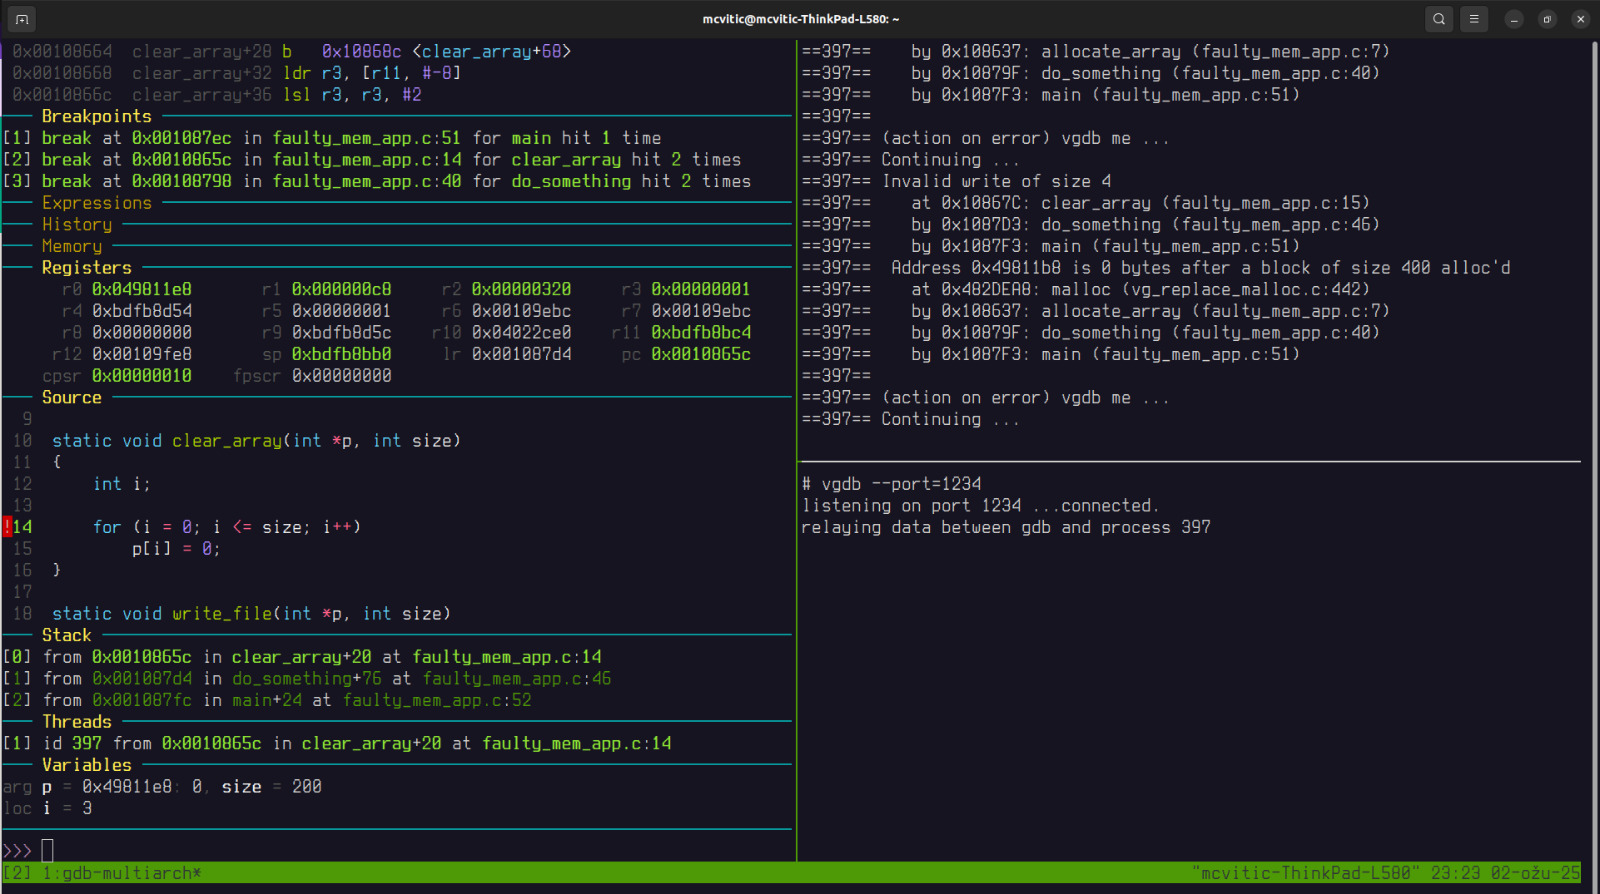
We can now debug each error using gdb with valgrind’s supervision which will interrupt the program each time it detects an error. The setup should now look something like this (same picture as the first one):
One more thing to note is that backtrace for leaks is not shown on the target because all libraries are stripped and thus do not have any debugging symbols anymore. This leads to the impossibility to use the DWARF information for backtracing.
First thing I always like to do is to set a breakpoint to main() and start the program to reach the application’s entry point. Then, we can set breakpoints to both functions mentioned in the backtrace above: clear_array() and do_something(). If we were to execute continue command, eventually, gdb would stop execution when valgrind detects an error as shown in the upper-right corner:
until we reach the end of execution:
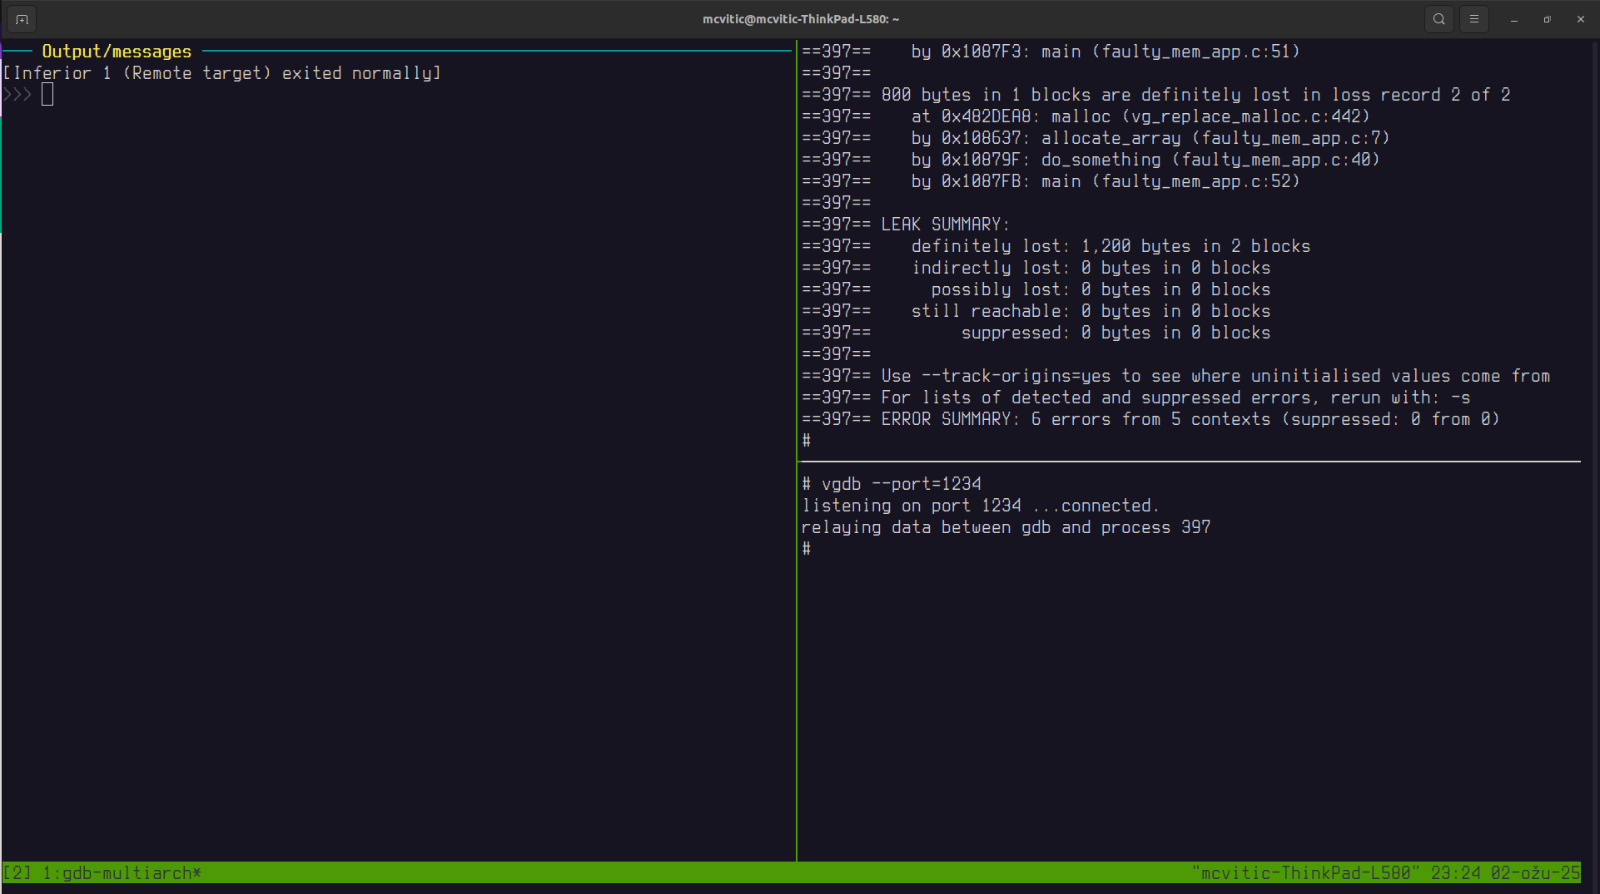
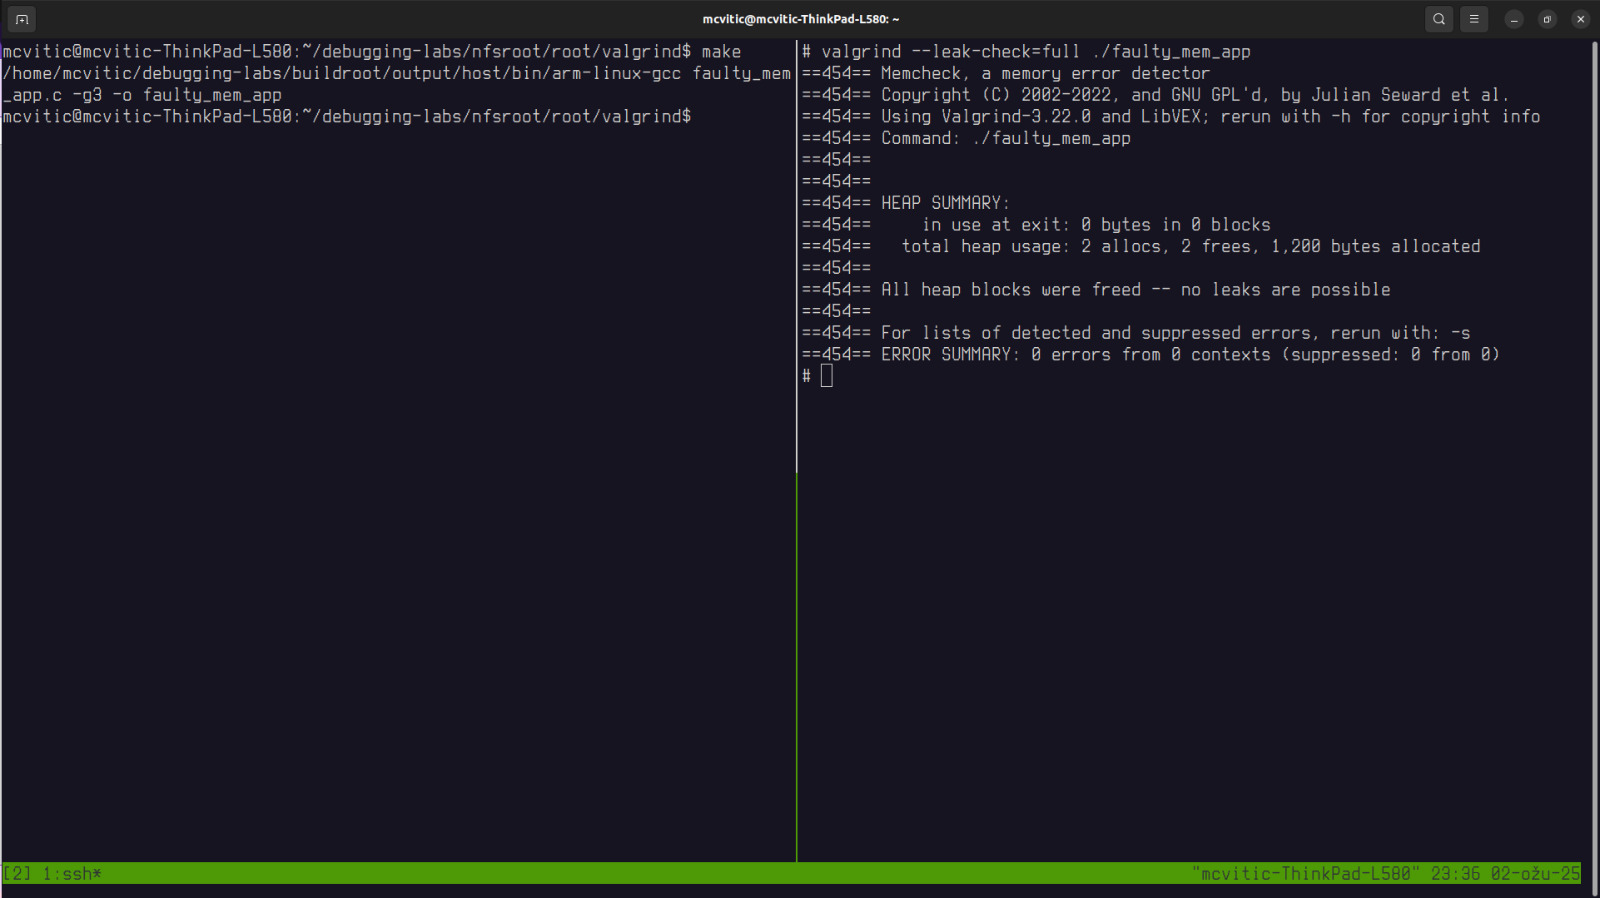
Solution to memory issues is quite straightforward and consists of changing<= to < in the clear_array() function. You can see the fixed source code here.
recompiling and running valgrind on the recompiled app will now give the following result:
Address Sanitizer
An even simpler way to detect memory errors is to use address sanitizer.
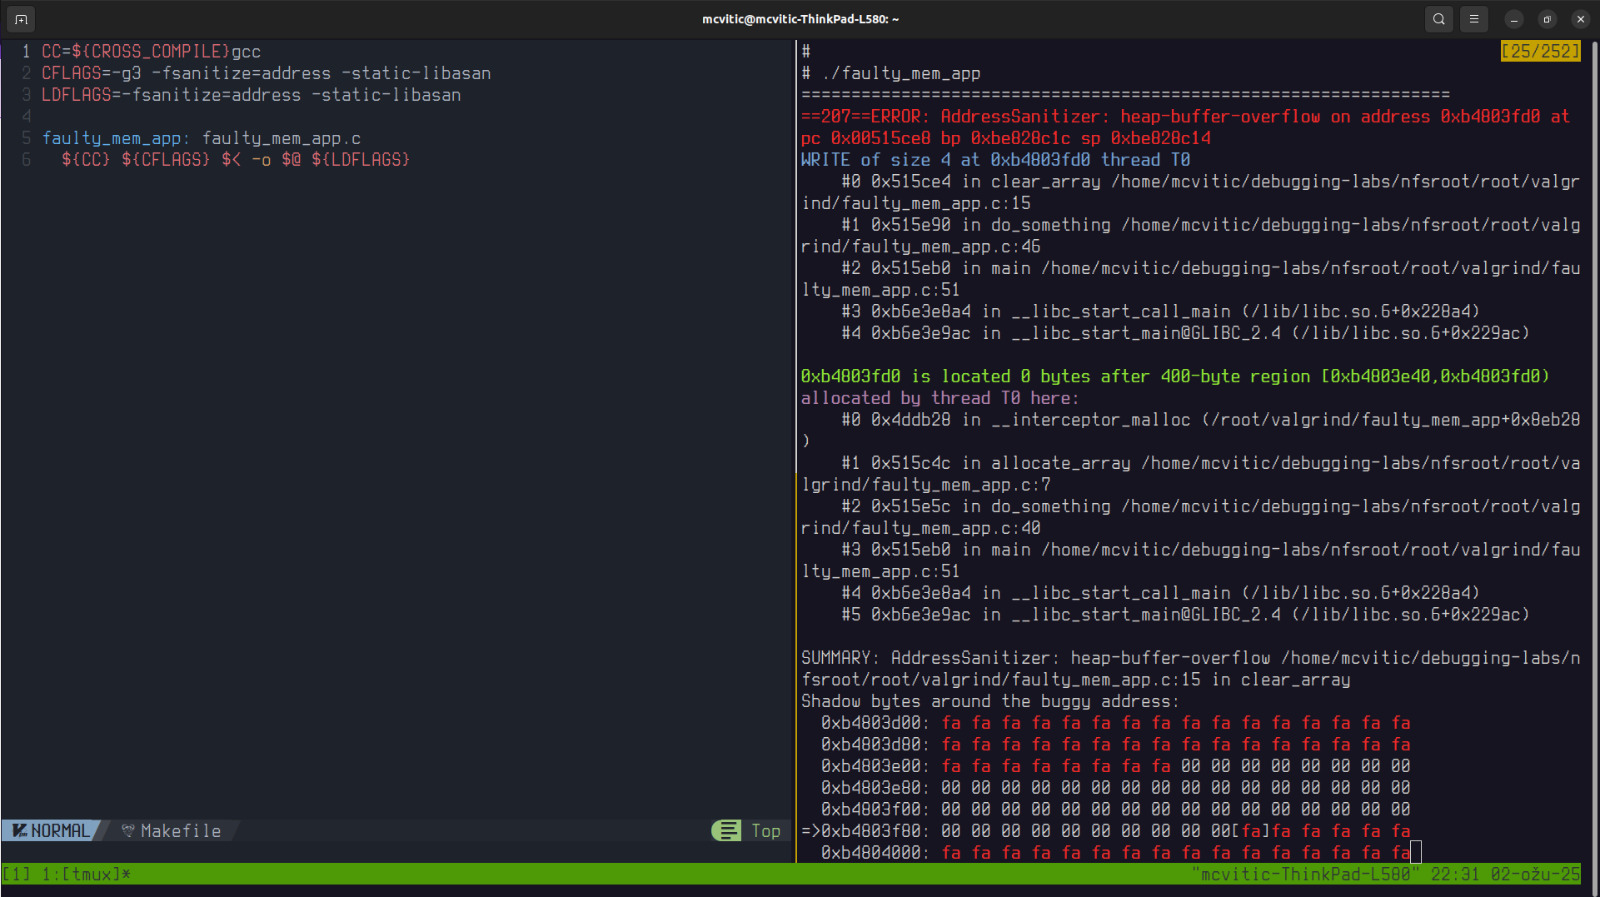
First, make sure you obtain address sanitizer. I downloaded it via apt on my Ubuntu machine:
$ sudo apt install libasan* # replace "*" with corresponding version of gcc you are using
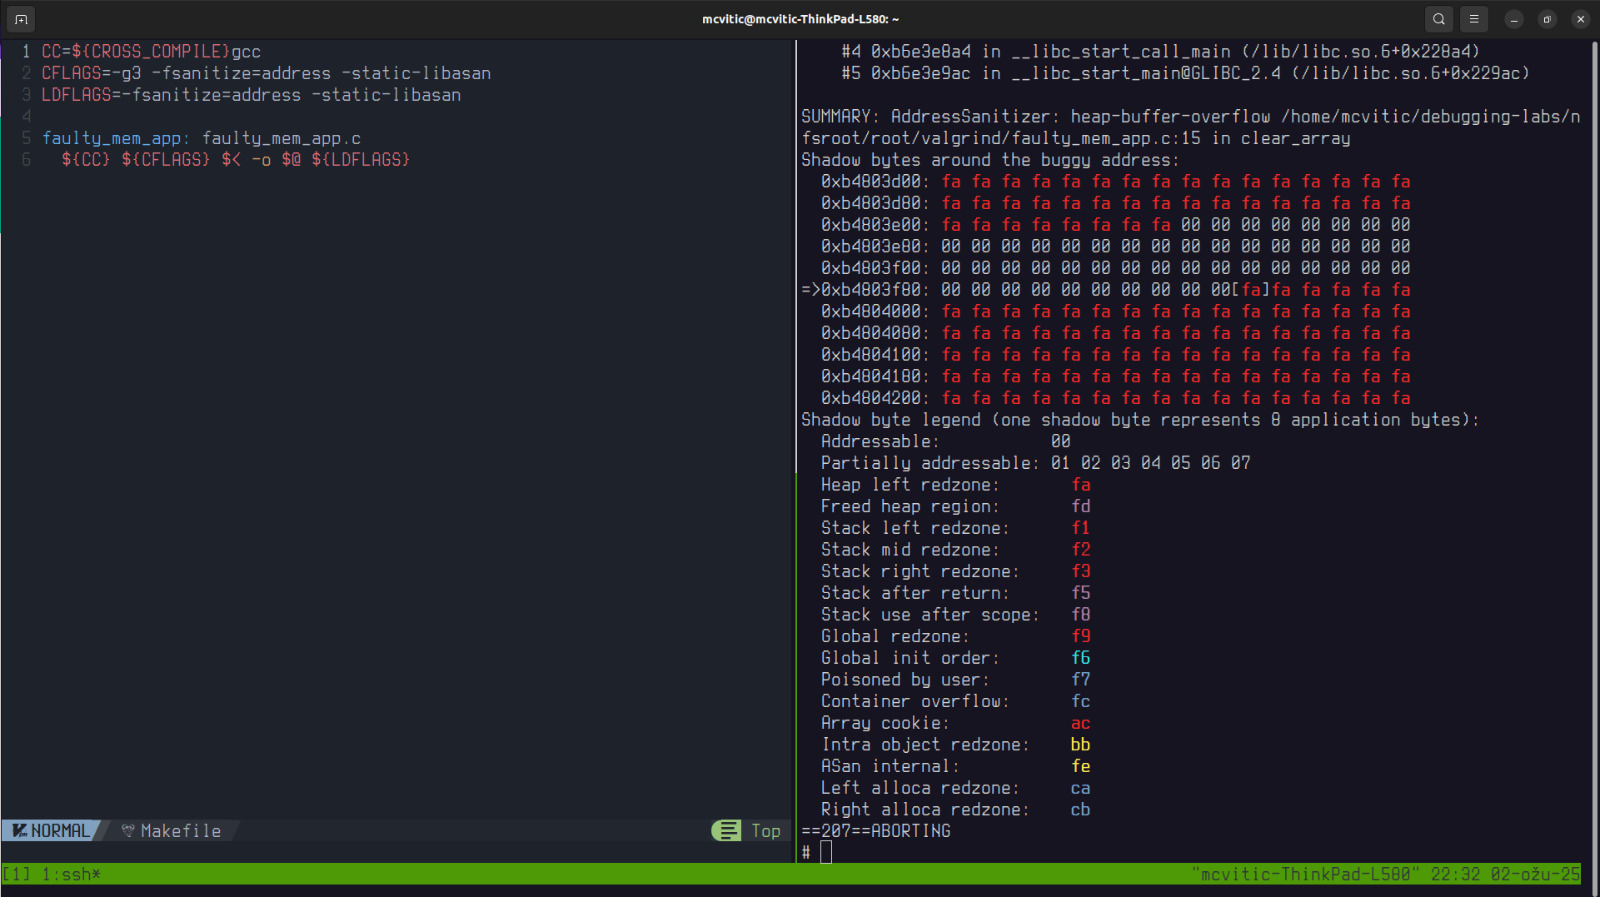
Once this was done, I opened the Makefile and simply added the following compiler and linker flags as shown below and just ran the app as I would when testing it’s behavior on the target:
Conclusion
Address sanitizer gave us a clear backtrace to the clear_array() function as the source of heap buffer overflow and more or less same information that valgrind provided. This is something I would first recommend someone to run their code through since it doesn’t require much effort to set up and yet gives quite a readable insight into where memory leaks lurk. If you want to go a step further and have observe leaky code dynamically, use valgrind with vgdb.
If you would like to support the work I do, consider donating here.